A $180 Million Picasso: What’s Making the Art Market Sizzle
The art market is hotter than a hoisted Rembrandt.
Last night at Christie’s in New York, Picasso’s “Les Femmes d’Alger (Version O)” sold for almost $180 million – the highest price ever paid at auction for a piece of art. There were said to be five bidders, and the winner remains anonymous.
At the same sale, a Giacometti sculpture, “L’homme au doigt,” went for a total of more than $141 million.
On May 5, at the first major auction of the spring selling season, Sotheby’s pulled in $368 million. It was the second-highest sale of Impressionist and modern art in the history of the auction house, according to The New York Times. The top seller was van Gogh’s “L’allée Des Alyscamps,” which fetched $66.3 million.
Related: 6 Traits of an Emerging Millionaire. Are you one?
The haul represented a 67 percent increase over Sotheby’s spring sale a year earlier, according to Bloomberg, which noted that many of the buyers were Asian.
The May 5 auction was only the second-highest because Sotheby’s held a sale last November that took in $422 million.
And tonight at a Sotheby’s auction of contemporary art, a painting entitled “The Ring (Engagement)” by the Pop artist Roy Lichtenstein could sell for as much as $50 million, the Times said.
What’s behind all those staggering numbers?
About a year and a half ago, the columnist Felix Salmon (then at Reuters, now at Fusion) ruminated about whether there was a bubble, which he defined as often driven by FOMO (fear of missing out), or a speculative bubble, one fueled by flippers, in the art market. His conclusion: the art market bubble was definitely not speculative.
“The people spending millions of dollars on trophy art aren’t buying to flip…,” he wrote.
Related: Get Ready for Another Real Estate Bubble
Still, Salmon said he was seeing signs that the market could be turning speculative. But they may have been false signals.
Recently, The Wall Street Journal wrote: “Spurred by the momentum of several successful sale seasons and an influx of newly wealthy global bidders, the major auction houses…say demand for status art is at historic levels and shows no signs of tapering off.”
But why?
In an April 17 article, the global news website Worldcrunch asked Financial Times journalist Georgina Adam, who wrote the 2014 book Big Bucks—The Explosion of the Art Market in the 21st Century, why so much money is rolling around the art market and driving up prices.
“Rich people used to be rich in terms of estate or assets, but not so much in terms of cash, like they are today,” she said.
“This growing billionaire population from developed or developing economies has money to spend and invest,” said the Worldcrunch article by Catherine Cochard. “For many of them, art — in the same way as luxury cars or prêt-à-porter — is an entry pass to a globalized way of life accessible through their wealth.”
That is a development that the keen eyes at the auction houses haven’t missed.
Chart of the Day: Boosting Corporate Tax Revenues
The leading candidates for the Democratic presidential nomination have all proposed increasing taxes on corporations, including raising income tax rates to levels ranging from 25% to 35%, up from the current 21% imposed by the Republican tax cuts in 2017. With Bernie Sanders leading the way at $3.9 trillion, here’s how much revenue the higher proposed corporate taxes, along with additional proposed surtaxes and reduced tax breaks, would generate over a decade, according to calculations by the right-leaning Tax Foundation, highlighted Wednesday by Bloomberg News.
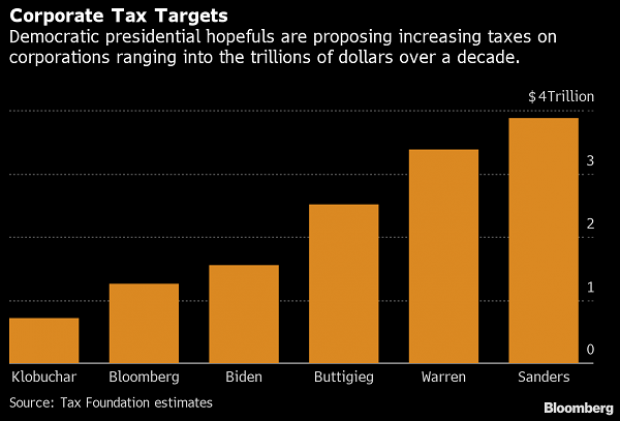
Chart of the Day: Discretionary Spending Droops
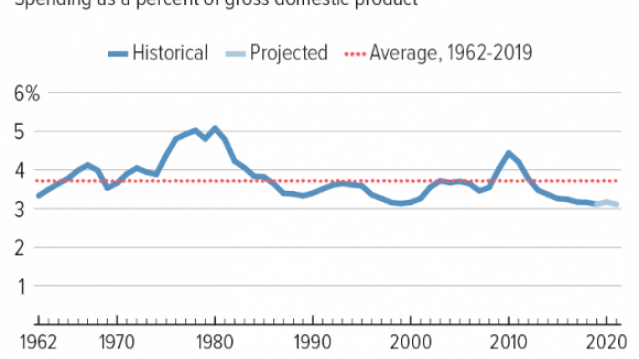
The federal government’s total non-defense discretionary spending – which covers everything from education and national parks to veterans’ medical care and low-income housing assistance – equals 3.2% of GDP in 2020, near historic lows going back to 1962, according to an analysis this week from the Center on Budget and Policy Priorities.
Chart of the Week: Trump Adds $4.7 Trillion in Debt
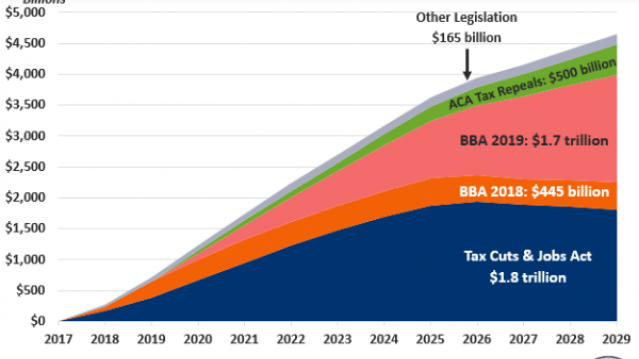
The Committee for a Responsible Federal Budget estimated this week that President Trump has now signed legislation that will add a total of $4.7 trillion to the national debt between 2017 and 2029. Tax cuts and spending increases account for similar portions of the projected increase, though if the individual tax cuts in the 2017 Republican overhaul are extended beyond their current expiration date at the end of 2025, they would add another $1 trillion in debt through 2029.
Chart of the Day: The Long Decline in Interest Rates
Are interest rates destined to move higher, increasing the cost of private and public debt? While many experts believe that higher rates are all but inevitable, historian Paul Schmelzing argues that today’s low-interest environment is consistent with a long-term trend stretching back 600 years.
The chart “shows a clear historical downtrend, with rates falling about 1% every 60 years to near zero today,” says Bloomberg’s Aaron Brown. “Rates do tend to revert to a mean, but that mean seems to be declining.”
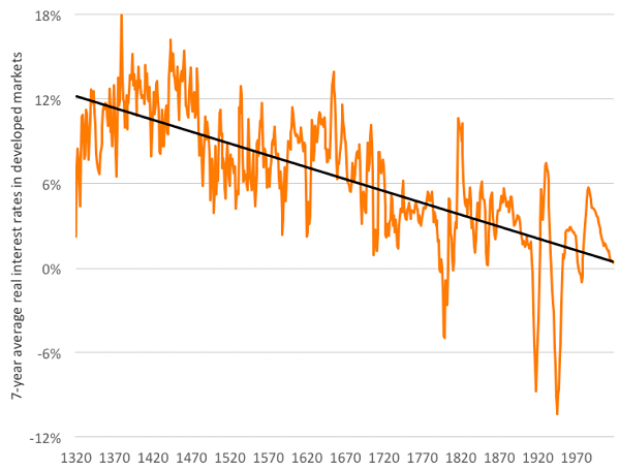
Chart of the Day: Drug Price Plans Compared

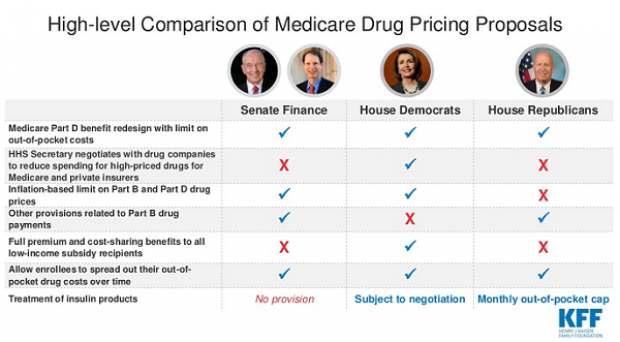
Lawmakers are considering three separate bills that are intended to reduce the cost of prescription drugs. Here’s an overview of the proposals, from a series of charts produced by the Kaiser Family Foundation this week. An interesting detail highlighted in another chart: 88% of voters – including 92% of Democrats and 85% of Republicans – want to give the government the power to negotiate prices with drug companies.
