Why We All Buy Tide: The 10 Biggest Advertisers in the U.S.

The 200 top national advertisers spent a record $137.8 billion last year trying to get you to buy more of their goods and services, an increase of 2 percent over 2013, according to Ad Age’s latest annual spending review.
That total was slightly more than the GDP of Hungary last year, but the growth rate was the lowest since 2009, as advertisers looked to get the most for their money. Internet display advertising among those 200 marketing Goliaths dropped by 13.3 percent.
Overall, 38 marketers spent more than $1 billion on advertising last year. Procter & Gamble remains the country’s (and the world’s) largest advertiser. It shelled out $4.6 billion in the U.S. alone to promote brands such as Crest, Duracell, Pampers and Tide — or well over $1 billion more than the next biggest spender. P&G’s CFO recently revealed plans to cut ad spending by as much as $500 million, though.
Here’s Ad Age’s list of the 10 biggest advertisers in the U.S. last year:
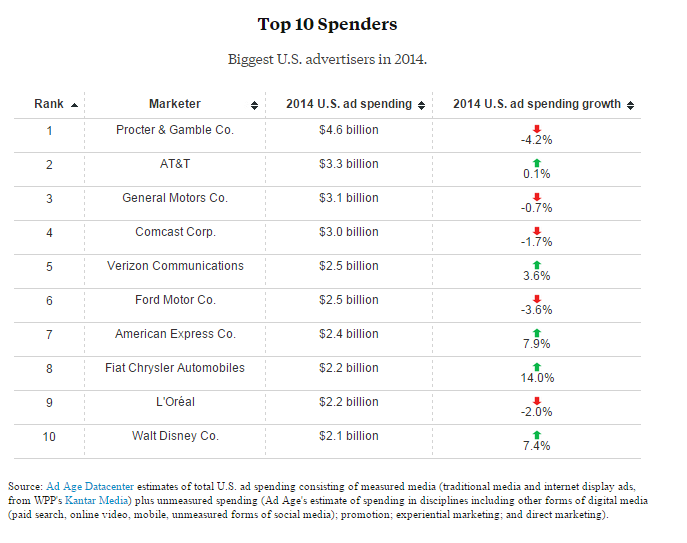
Chart of the Day: Boosting Corporate Tax Revenues

The leading candidates for the Democratic presidential nomination have all proposed increasing taxes on corporations, including raising income tax rates to levels ranging from 25% to 35%, up from the current 21% imposed by the Republican tax cuts in 2017. With Bernie Sanders leading the way at $3.9 trillion, here’s how much revenue the higher proposed corporate taxes, along with additional proposed surtaxes and reduced tax breaks, would generate over a decade, according to calculations by the right-leaning Tax Foundation, highlighted Wednesday by Bloomberg News.

Chart of the Day: Discretionary Spending Droops

The federal government’s total non-defense discretionary spending – which covers everything from education and national parks to veterans’ medical care and low-income housing assistance – equals 3.2% of GDP in 2020, near historic lows going back to 1962, according to an analysis this week from the Center on Budget and Policy Priorities.
Chart of the Week: Trump Adds $4.7 Trillion in Debt

The Committee for a Responsible Federal Budget estimated this week that President Trump has now signed legislation that will add a total of $4.7 trillion to the national debt between 2017 and 2029. Tax cuts and spending increases account for similar portions of the projected increase, though if the individual tax cuts in the 2017 Republican overhaul are extended beyond their current expiration date at the end of 2025, they would add another $1 trillion in debt through 2029.
Chart of the Day: The Long Decline in Interest Rates

Are interest rates destined to move higher, increasing the cost of private and public debt? While many experts believe that higher rates are all but inevitable, historian Paul Schmelzing argues that today’s low-interest environment is consistent with a long-term trend stretching back 600 years.
The chart “shows a clear historical downtrend, with rates falling about 1% every 60 years to near zero today,” says Bloomberg’s Aaron Brown. “Rates do tend to revert to a mean, but that mean seems to be declining.”

Chart of the Day: Drug Price Plans Compared

Lawmakers are considering three separate bills that are intended to reduce the cost of prescription drugs. Here’s an overview of the proposals, from a series of charts produced by the Kaiser Family Foundation this week. An interesting detail highlighted in another chart: 88% of voters – including 92% of Democrats and 85% of Republicans – want to give the government the power to negotiate prices with drug companies.
