Middle-class families account for a growing share of social safety net spending in the U.S., according to a report from the Brookings Institution Tuesday.
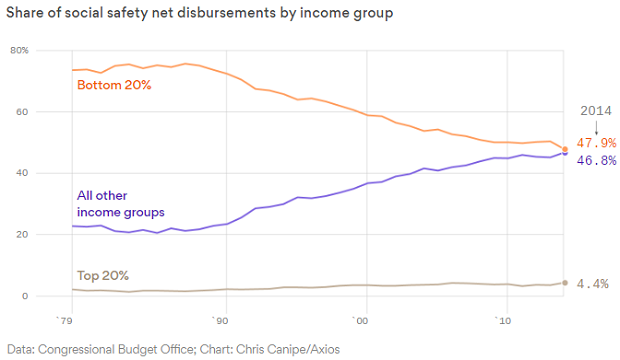
The Axios chart below, based on the Brookings report, shows the shift between 1979 and 2014 in the share of means-tested social welfare spending among different income groups. The “middle class” group (labeled “all other income groups” in the chart) is defined as the middle 60 percent of the income distribution — for a family of three, that includes those earning between $36,600 and $146,700 in 2014. That group accounted for about 23 percent of all means-tested social welfare spending in 1979 but about 46 percent in 2014, roughly matching the spending for the poorest 20 percent of families.
The means-tested outlays include:
- Medicaid
- low-income subsidies for Medicare Part D prescription drug coverage
- Children’s Health Insurance Program (CHIP)
- food stamps (Supplemental Nutrition Assistance Program, or SNAP)
- Supplemental Security Income (SSI, administered by Social Security)
- Temporary Assistance for Needy Families (formerly called Aid to Families with Dependent Children)
- cost-sharing reduction payments (created by the Affordable Care Act)
- child nutrition programs
- Low Income Home Energy Assistance Program
- state and local assistance programs.
The biggest increase in spending share was seen in what the authors call the lower-middle class — families between 13 percent and 26 percent in the income distribution. But all middle-class income groups saw a rough doubling of their share of spending, and by 2014, $1 out of every $7 spent on means-tested programs was received by a middle-class family.
Two of the big drivers in the increase, authors Richard V. Reeves and Christopher Pulliam found, have been Medicaid and food stamps. Families in the bottom 20 percent of the income distribution accounted for a substantial majority (71 percent) of Medicaid spending in 1979, but by 2014 accounted for a bit less than half — meaning that most Medicaid spending now goes to families in the top 80 percent of the income distribution.
Age is another key factor. Examining just households headed by someone 65 or older, the authors found that “the middle class now takes up nearly 60 percent of the means-tested transfer pie—three times more than they did in 1979.” Rising health care costs play a big role, with Medicaid and subsidies for Medicare Part D accounting for much of the increased spending.
Overall, the report highlights the increasing importance of transfer payments to middle-class households. “Safety net benefits have steadily grown as a proportion of income (after taxes and transfers) not only for the poorest, but for middle-income households too,” the authors concluded.


