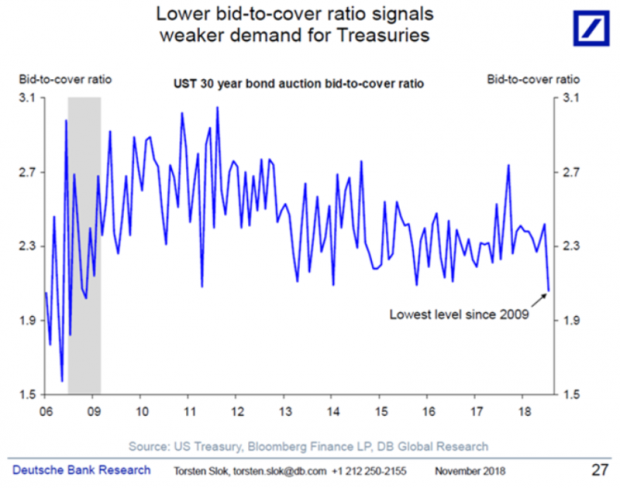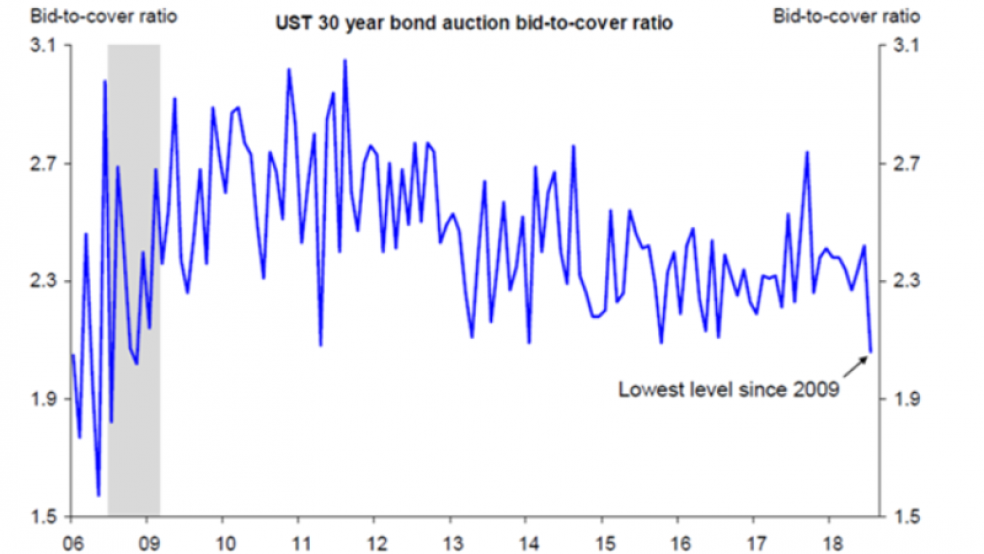
Bloomberg’s John Auther and The Washington Post’s Heather Long both highlight this chart from Deutsche Bank’s chief U.S. economist, Torsten Slok, showing weaker demand for 30-year Treasury bonds. “This could be a big problem: The Trump Administration is issuing $1.3 trillion in US government debt this year, more than 2x the 2017 amount,” Long notes on Twitter. “Meanwhile, demand for US debt is at the lowest level in nearly a decade (foreign buyers are drying up, largely b/c of strong dollar).”
Auther also notes that primary dealers, the large banks that trade with the Federal Reserve and must bid at Treasury auctions, have more long-term Treasuries on their books than ever. “They’re unlikely to be holding this much inventory because they like Treasuries,” Auther says. “A more probable explanation is that they can’t find willing buyers, and will treat any decline in yields (or increase in bond prices) as an opportunity to decrease their inventory.”
Economist Ernie Tedeschi points out, though, that the demand picture for 10-year Treasuries looks much more stable than the 30-year Treasury chart below. “Safe asset demand was one of the factors underweighted by fiscal hawks in the depths of the crisis, and one reason why the enormous growth in US debt post-2008 coincided with low-interest rates,” he writes. “But the flip side is that safe asset demand is not insatiable.”