

We have come down to the final few days of an election cycle that feels like the longest in history. That’s probably not the case; the race started earlier in 2008, and the primaries took place in both parties. This one just seems longer, perhaps because of the negative advertising that has tossed every possible issue into the laps of voters: Bain Capital, Benghazi, Big Bird, bayonets, Jeeps, and binders full of women, just to name a few.

In the end, though, this election hinges on the core issues of jobs and the economy. Barack Obama realized that, belatedly rushing out a 20-page “jobs plan” with two weeks left in the campaign that primarily consisted of rehashed slogans and promises from the 2008 election. Until that point, as I noted the week before the release of the glossy pamphlet, Obama had tried to run against Mitt Romney’s agenda, and away from his own record.
Unfortunately, incumbents don’t have that luxury in reelection bids, as the Obama campaign has discovered, nor do voters really care about Big Bird as an election issue – in either direction. As Gallup reported last week, Americans are more focused on economic issues this cycle than even in 2008, when the financial system neared collapse and the US economy started shedding jobs by the hundreds of thousands. People want answers on what direction the next four years will take on economic growth, unemployment, and the federal budget deficit.
With that in mind, the Obama campaign published the graph below on its website, urging supporters to send it to their friends and family. This is apparently President Obama’s best evidence for his economic policies:
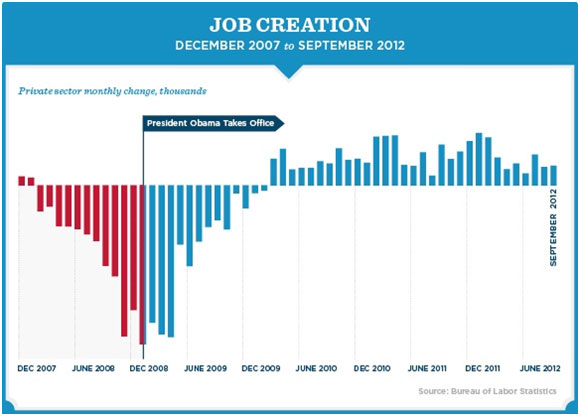
This certainly looks impressive, and it emphasizes the Obama argument that he inherited a mess that he feels has largely been fixed. After more than two years of job losses, Obama’s chart argues, he’s produced “31 consecutive months of job growth and 5.2 million new private sector jobs.” On that basis, Obama wants a mandate for four more years of the current economic policies in place.
However, a few more charts should put this into proper context – as well as better math. The claim that the economy has added 5.2 million private-sector jobs is only accurate if one doesn’t include several months of net job losses during the Obama term, or even just the recovery that started in June 2009, as part of the total.
When Obama took office, the US had 110,985,000 private-sector jobs, according to the Bureau of Labor Statistics and its Establishment Survey, the source of the data in Obama’s chart. As of the data for September 2012, the US has 111,499,000 private-sector jobs, for a grand total increase of 514,000 jobs in nearly four years. That’s one-tenth of the jobs Obama claims were created.
Part of the disconnect is that the US continued to bleed jobs from the recession that started before Obama took office. How about from the start of the recovery – which, readers will recall, began four months after Obama got his $800 billion stimulus plan passed in Congress? As of June 2009, the US had 107,933,000 private-sector jobs, which means we have gained 3.566 million jobs in this sector during the entire 40-month recovery.
That’s an average of 89,150 jobs per month – which doesn’t come close to keeping pace with population growth. Economists put the threshold for new jobs in relation to population growth at 125,000 per month. In order to regain the jobs lost during the recession, we’d need to see job growth at a level of 250,000 sustained over as long as five years. This is one reason why Obama’s chart doesn’t show any numbers on the axes, which would indicate just how weak even the better months on this series have been. In the 31 months Obama cites, we have hit or surpassed the 250,000 mark only five times.
The better measure for job growth in relation to population comes from the BLS series on the civilian population participation rate in the workforce. The chart below shows this measure over the last ten years:
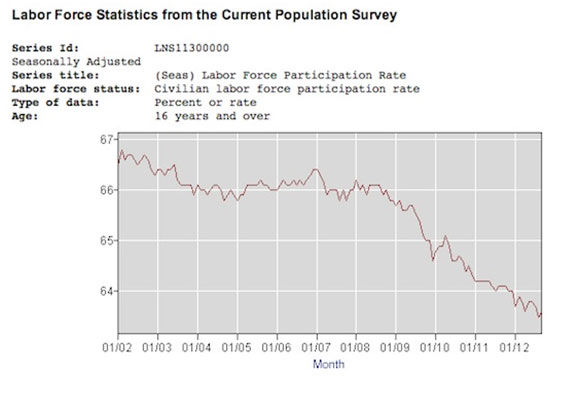
This paints a much more accurate picture of job growth in the Obama recovery. When Obama took office, 65.7 percent of the working age civilian population was part of the workforce, either employed or actively seeking work. At the start of the recovery in June 2009, that number remained at 65.7 percent. It’s now down to 63.6 percent. one-tenth of a point higher than its 31-year low in August. Another measure of civilian employment, the employment-population ratio, looks even more dramatic:
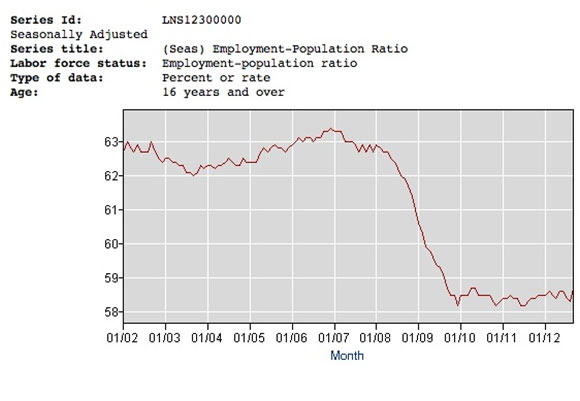
Both of these charts tell a much different story on jobs than does the chart and data from Obama’s campaign this week. They draw a picture of stagnation and decline. Adoption of Obama’s policies for another four years, as his “new” jobs plan announced last week promises, would only serve to cement this level of stagnation as a “new normal” for America, and consign us to a lost decade – or worse – as our future.
Small wonder, then, that Obama waited until almost literally the last minute to tell voters that he wants to stay this course. Voters need to arm themselves with the proper context and data for how they most closely experience the economy – through employment – and take action for real change on Tuesday.