For all the chatter over the past year surrounding declining corporate earnings, the strong dollar, weakness in crude oil and the likelihood of the Federal Reserve’s first rate hike since 2006, stocks really haven't gone anywhere.
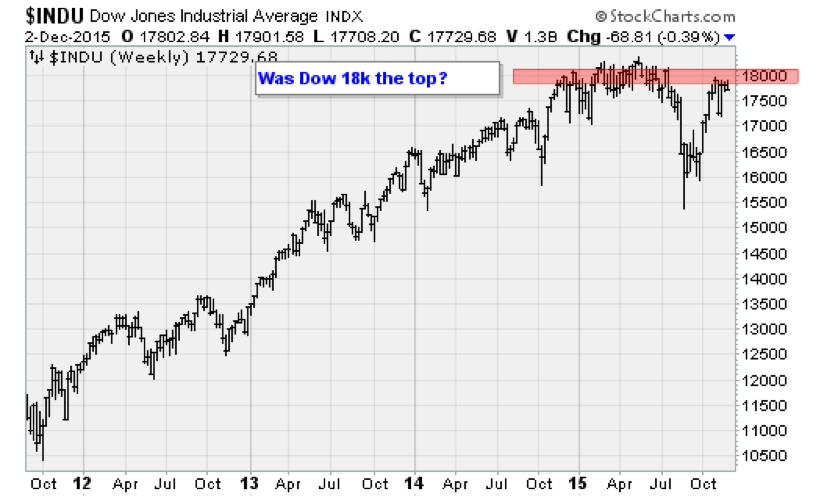
The S&P 500 is up a less-than-robust 0.1 percent on the year. The Dow Jones Industrial Average closed above the 18,000 level just before Christmas 2014 in a picture-perfect display of holiday cheer and optimism. Nearly a year later, the Dow just closed at 17,729 after spending most of 2015 clinging desperately to the 18,000 mark.
Related: Here’s Why Stocks May See a Year-End Rally
Was that as good as it's going to get for this cycle? The evidence is growing that it was.

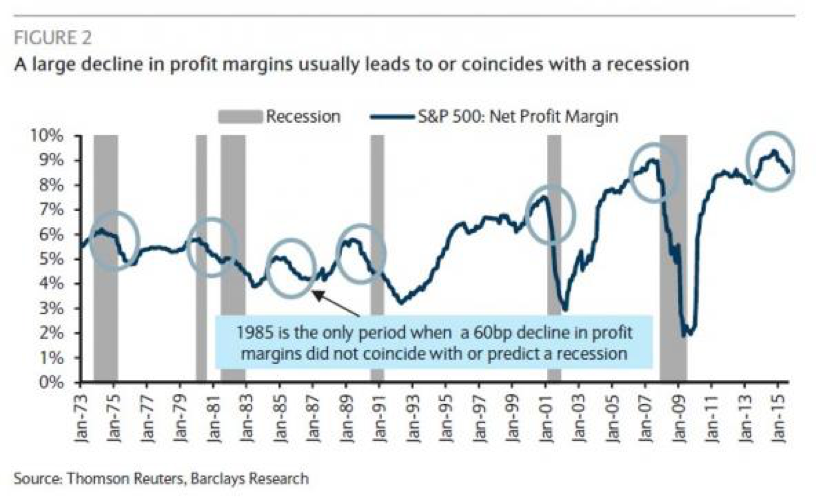
For one, as highlighted by Barclays Research in the chart below, wage gains, a strong dollar, demand weakness overseas, a U.S. manufacturing slowdown (weakest month since 2009) and low commodity prices are all pressuring corporate profit margins in a big way. Since 1973, such a drop in profitability has only been seen during recessions, save for the lone exception of the 1985 profitability downturn.
Related: Here’s Why U.S. Investors Are Getting Excited About Iran

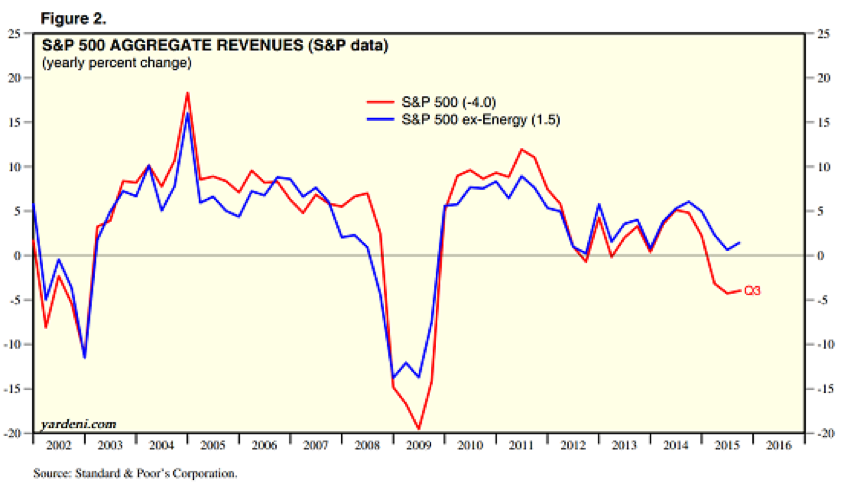
The drop in profitability has resulted in aggregate S&P 500 earnings setting a pattern of lower highs and lower lows, according to data compiled by Yardeni Research — a pattern last seen in 2007-2008. S&P 500 aggregate revenues are contracting at a 4 percent annual rate, a level of contraction not seen since the recession was ending.

If profitability is contracting, Credit Suisse warns that the top of the bull market may have already been set: The peak of the last four bull markets occurred within 12-to-18 months after the peak in profitability.
If you're an optimist, you've got to find a thesis that justifies a powerful rebound in profitability.
Factors like a weak labor market, ultra-low interest rates, high energy prices and an emerging-market credit boom have all come and gone. Even the saturation of the smartphone market is casting a pall over the enthusiasm for one-time favorite stocks like Apple (AAPL). Biotech is under political pressure. The Internet of Things, autonomous vehicles, machine learning and other new-tech developments are hopes for the next cycle.
Late-cycle dynamics are coming into play: Higher interest rates, higher labor costs and higher corporate debt default rates. All will further pressure overall profit margins.
Related: Why Raising Interest Rates Isn’t as Easy as It Sounds
Wall Street is battening down the hatches.
Especially in the bond market. The yield curve — the relationship between short-term and long-term interest rates — is quickly flattening at the same time high-yield or "junk" bond prices are weakening. According to the team at SentimenTrader, this has only been seen three other times on a long-term basis: Before bear markets in 1990, 2000 and 2008.
In the options market, bets against stocks are ramping up: The S&P 100 open interest rate shows traders are holding 273 put options for every 100 call options, the third-highest level in history.
Foreign investors are bailing too: According to Fed data, in the six months through September, foreign investors sold a net $65 billion in U.S. stocks, the most in at least 40 years. As a percentage of total market capitalization, this is still one of the largest capital outflows in history.
Add it all up and one thing becomes clear: Unlike last year, this Christmas is looking a lot more foreboding for the average American investor.


