

Stocks opened higher Thursday, but with four days of losses in the last five sessions, U.S. equities have been threatening a breakdown and their first significant selloff in six months.
There is no single catalyst for the recent bout of weakness, just a combination of several nagging concerns ahead of Friday’s non-farm payroll report and the approach of the June policy decision from the Federal Reserve.
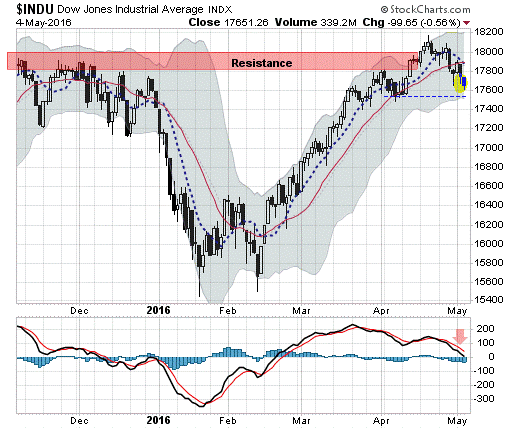
On a technical basis, weakness seems to be spreading. The percentage of S&P 500 stocks in uptrends has fallen below 75 percent for the first time since the middle of March. After the Dow Jones Industrial Average bumped up against overhead resistance near 18,000 — a level that has kept a lid on the bull market since late 2014 — a drop below the 17,600 level would mark a clear breakdown out of a three-month topping pattern and confirm the first significant downtrend since December.
Related: Are Stock Market Bears About to Get Clobbered Again?
Some investors were focused on reports the European Central Bank reportedly wants to stay in "wait and see mode" on stimulus amid a recent increase in pressure on Eurozone banks. Without the near-term hope of fresh easing measures, the situation is likely to get worse before it gets better. The chatter is that there isn't likely to be any new easing effort before September.
Another factor has been recent pressure on industrial metals, with copper and iron ore both on the slide. China continues to rein in speculation in the metals, with open interest in active iron-ore contracts on the Shanghai Futures Exchange dropping to its lowest level since November.
Also, China just devalued the yuan by the most since August — an event that unleashed U.S. market volatility and weakness last summer.
Related: The Retirement Revolution That Failed: Why the 401(k) Isn’t Working
There's more. Global growth concerns are in focus after Australia's surprise interest rate cut earlier this week, weaker Chinese manufacturing data and weak bank earnings in the U.K. and Europe. In the U.S., the Citigroup Economic Surprise Index has fallen to its lowest level in more than 10 months.
The iShares Emerging Markets (EEM) exchange-traded fund has dropped below its 200-day moving average and 50-day moving average to end a three-month topping pattern. Strength in the dollar and global growth worries have hit foreign equities.
Treasury bonds are attacking their 20-day moving average in what looks like the first new short-term uptrend since March — a sign investors are scrambling for safety and a refuge from the recent rise in market volatility. High-yield, or junk, bonds as represented by the Barclays High Yield Bond ETF (JNK) suffered their worst two-day loss since early February as a flurry of energy sector defaults raises concerns about the risk/reward balance involved for investors. And small-cap stocks in the Russell 2000 have dropped below their 200-day moving average, reversing a breakout from early April.
Related: Sell in May and Go Away? There’s a Smarter Play
Of course, all of this comes just as the calendar has turned to May, which marks the start of the worst six months of the year for the stock market based on historic seasonality. You know, "Sell in May and go away." According to Jeff Hirsch of Almanac Trader, from April 1950 to October 2015, the S&P 500 gained 1,857 points in the months from November through April but only 203 points between May and October.
The seasonality effect is magnified during election years, according to Hirsch.
We know the home stretch this election season will be a wild ride politically, but it looks like the same will be true for the markets.