This College Choice Could Make You $3Million Richer

The differences in starting salaries for STEM majors versus those who study the humanities have been widely publicized. Now, a new study looks at how those differences add up over a lifetime of earnings – and the results are staggering.
The lowest paid graduates, early childhood education majors, earn just $39,000 annually mid-career, while the highest paid petroleum engineering majors, make an average of $136,000 per year. Over a career, that difference amounts to more than $3 million, according to the report The Economic Value of College Majors by economists at Georgetown University.
Among the major fields of study, architecture and engineering students earn highest average salary--$83,000 per year, and education majors earn the lowest--$45,000 per year.
Related: 10 Public Universities with the Worst Graduation Rates
The study finds that generally it’s still worth it to go to college. The average bachelor’s degree holder makes $1 million more over a lifetime than a person with just a high school diploma.
A separate report released last fall by the Federal Reserve Bank of New York found that the value of a bachelor’s degree has reached an all-time high of around $300,000. Researchers found that it takes about 10 years to recoup the cost of a degree, a historically low level, down from close to 25 years in the late 1970s and 1980s.
So those education majors should still go to college, but they might be smart to look for more moderately priced options and to be more wary about taking on debt than their engineering peers.
Coming Soon: Deductible Relief Day!

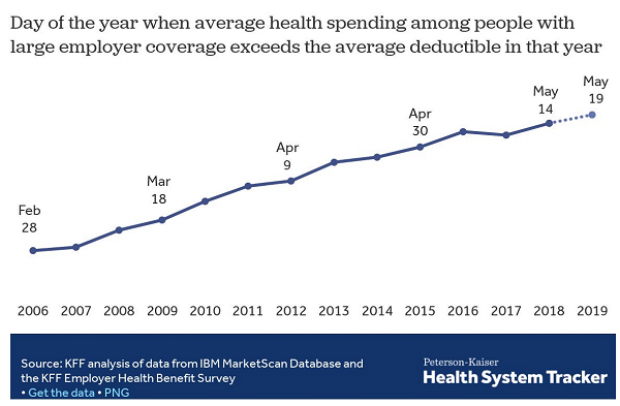
You may be familiar with the concept of Tax Freedom Day – the date on which you have earned enough to pay all of your taxes for the year. Focusing on a different kind of financial burden, analysts at the Kaiser Family Foundation have created Deductible Relief Day – the date on which people in employer-sponsored insurance plans have spent enough on health care to meet the average annual deductible.
Average deductibles have more than tripled over the last decade, forcing people to spend more out of pocket each year. As a result, Deductible Relief Day is “getting later and later in the year,” Kaiser’s Larry Levitt said in a tweet Thursday.
Chart of the Day: Families Still Struggling
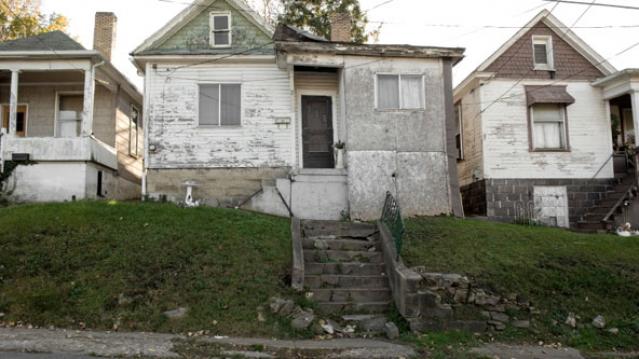
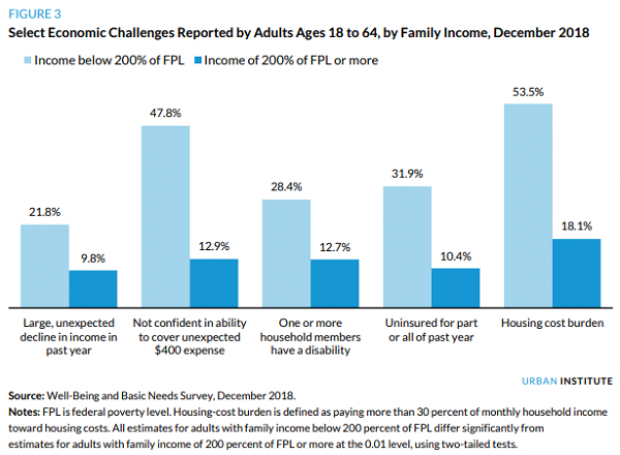
Ten years into what will soon be the longest economic expansion in U.S. history, 40% of families say they are still struggling, according to a new report from the Urban Institute. “Nearly 4 in 10 nonelderly adults reported that in 2018, their families experienced material hardship—defined as trouble paying or being unable to pay for housing, utilities, food, or medical care at some point during the year—which was not significantly different from the share reporting these difficulties for the previous year,” the report says. “Among adults in families with incomes below twice the federal poverty level (FPL), over 60 percent reported at least one type of material hardship in 2018.”
Chart of the Day: Pragmatism on a Public Option
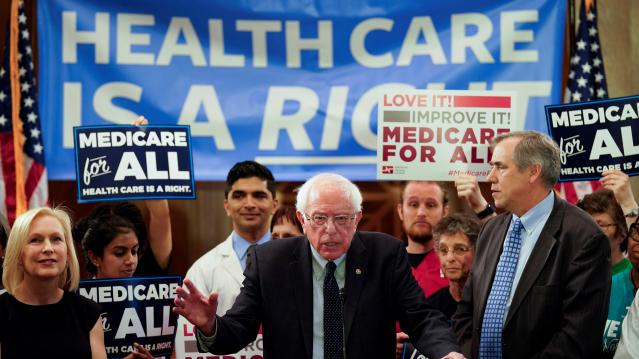
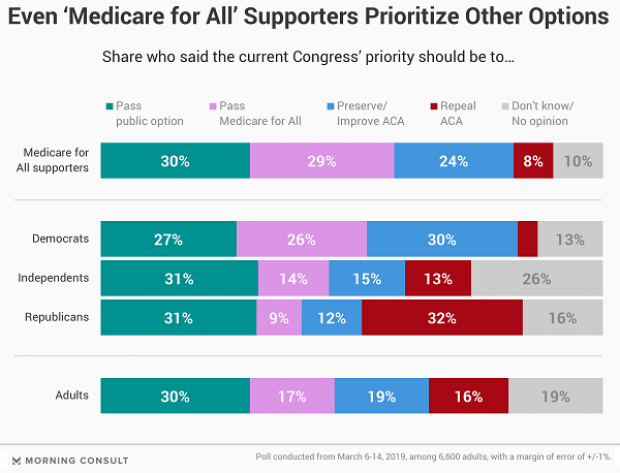
A recent Morning Consult poll 3,073 U.S. adults who say they support Medicare for All shows that they are just as likely to back a public option that would allow Americans to buy into Medicare or Medicaid without eliminating private health insurance. “The data suggests that, in spite of the fervor for expanding health coverage, a majority of Medicare for All supporters, like all Americans, are leaning into their pragmatism in response to the current political climate — one which has left many skeptical that Capitol Hill can jolt into action on an ambitious proposal like Medicare for All quickly enough to wrangle the soaring costs of health care,” Morning Consult said.
Chart of the Day: The Explosive Growth of the EITC

The Earned Income Tax Credit, a refundable tax credit for low- to moderate-income workers, was established in 1975, with nominal claims of about $1.2 billion ($5.6 billion in 2016 dollars) in its first year. According to the Tax Policy Center, by 2016 “the total was $66.7 billion, almost 12 times larger in real terms.”
Chart of the Day: The Big Picture on Health Care Costs

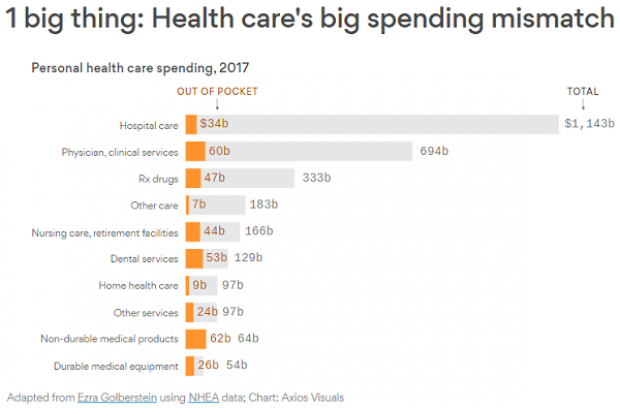
“The health care services that rack up the highest out-of-pocket costs for patients aren't the same ones that cost the most to the health care system overall,” says Axios’s Caitlin Owens. That may distort our view of how the system works and how best to fix it. For example, Americans spend more out-of-pocket on dental services ($53 billion) than they do on hospital care ($34 billion), but the latter is a much larger part of national health care spending as a whole.

