We Just Went Through the Worst Month Since the Great Recession

We already knew the economy really struggled over the first few months of 2015, with March being especially rough. A new report from economists at Macroeconomic Advisers shows just how bad a month it really was.
The forecasting firm, which tracks economic progress on a monthly basis rather than just a quarterly one, now says that GDP fell 1 percent in March. “This was the largest decline since December 2008, when the U.S. economy was in the throes of recession,” its update notes.
The Commerce Department initially estimated that GDP grew at a seasonally adjusted annual rate of 0.2 percent in the first quarter. An updated report, due May 29, is now expected to show that the economy actually shrank over the first three months of the year. J.P. Morgan economists have lowered their tracking estimate of first-quarter GDP from -0.8 percent to -1.1 percent based on data released over the last two days.
Related: Why So Many Americans Are Trapped in ‘Deep Poverty’
As we’ve written before, though, the downturn isn’t necessarily reason to worry about the fundamental health of the economy, or at least it shouldn’t stoke fears that we’re diving into another recession. As the Macroeconomic Advisers report explains, “A sharp decline in net exports more than accounted for the decline in monthly GDP, as resolution to the West Coast port dispute led to a surge in imports to well above the recent trend. As a result, they write, they believe the one-month plunge “overstates the underlying weakness in the economy.”
That’s not to say the economy is particularly strong, either. Both Macroeconomic Advisers and J.P. Morgan now forecast second-quarter GDP growth to come in at a tepid 2 percent annualized rate.
Deficit Hits $738.6 Billion in First 8 Months of Fiscal Year
The U.S. budget deficit grew to $738.6 billion in the first eight months of the current fiscal year – an increase of $206 billion, or 38.8%, over the deficit recorded during the same period a year earlier. Bloomberg’s Sarah McGregor notes that the big increase occurred despite a jump in tariff revenues, which have nearly doubled to $44.9 billion so far this fiscal year. But that increase, which contributed to an overall increase in revenues of 2.3%, was not enough to make up for the reduced revenues from the Republican tax cuts and a 9.3% increase in government spending.
Tweet of the Day: Revenues or Spending?

Rep. Kevin Brady (R-TX), ranking member of the House Ways and Means Committee and one of the authors of the 2017 Republican tax overhaul, told The Washington Post’s Heather Long Tuesday that the budget deficit is driven by excess spending, not a shortfall in revenues in the wake of the tax cuts. The Wall Street Journal’s Kate Davidson provided some inconvenient facts for Brady’s claim in a tweet, pointing out that government revenues as a share of GDP have fallen significantly since 2015, while spending has remained more or less constant.
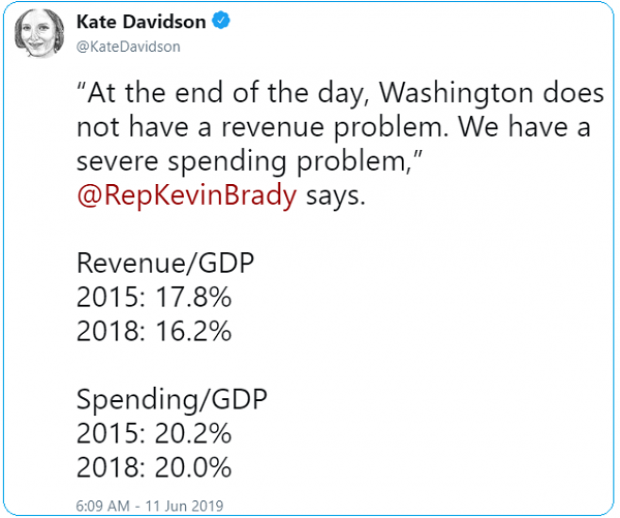
Chart of the Day: The Decline in IRS Audits

Reviewing the recent annual report on tax statistics from the IRS, Robert Weinberger of the Tax Policy Center says it “tells a story of shrinking staff, fewer audits, and less customer service.” The agency had 22% fewer personnel in 2018 than it did in 2010, and its enforcement budget has fallen by nearly $1 billion, Weinberger writes. One obvious effect of the budget cuts has been a sharp reduction in the number of audits the agency has performed annually, which you can see in the chart below.

Number of the Day: $102 Million

President Trump’s golf playing has cost taxpayers $102 million in extra travel and security expenses, according to an analysis by the left-leaning HuffPost news site.
“The $102 million total to date spent on Trump’s presidential golfing represents 255 times the annual presidential salary he volunteered not to take. It is more than three times the cost of special counsel Robert Mueller’s investigation that Trump continually complains about. It would fund for six years the Special Olympics program that Trump’s proposed budget had originally cut to save money,” HuffPost’s S.V. Date writes.
Date says the White House did not respond to HuffPost’s requests for comment.
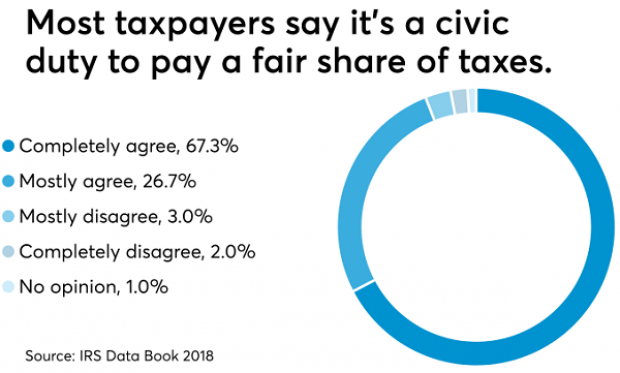
Americans See Tax-Paying as a Duty
The IRS may not be conducting audits like it used to, but according to the agency’s Data Book for 2018, most Americans still believe it’s not acceptable to cheat on your taxes. About 67% of respondents to an IRS opinion survey “completely agree” that it’s a civic duty to pay “a fair share of taxes,” and another 26% “mostly agree,” bringing the total in agreement to over 90%. Accounting Today says that attitude has been pretty consistent over the last decade.