6.6M Homes at Risk of Hurricane Damage This Year. Here’s Which States They’re In
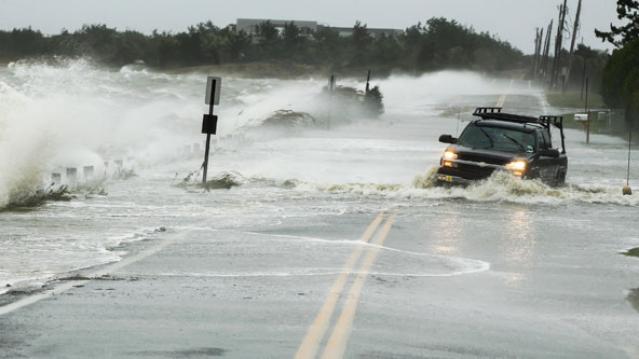
As hurricane season gets underway, real estate analytics firm CoreLogic is warning that there are more than 6.6 million U.S. homes at risk of being hit by a storm surge. That could lead to as much at $1.5 trillion in damage.
The homes are in 19 states and the District of Columbia along the Atlantic and Gulf Coasts. Six states account for more than three-quarters of all at-risk homes, with Florida having the most (2.5 million), followed by Louisiana (760,000), New York (465,000), New Jersey (446,148), Texas (441,304) and Virginia (420,052).
Related: How Climate Change Costs Could Soar to the Billions
“The number of hurricanes each year is less important than the location of where the next hurricane will come ashore,” CoreLogic’s senior hazard risk analyst said in a statement. “It only takes one hurricane that pushes storm surge into a major metropolitan area for the damage to tally in the billions of dollars. With new home construction, and any amount of sea-level rise, the number of homes at risk of storm surge damage will continue to increase.”
The District of Columbia has the lowest number of properties at risk (3,700), followed by New Hampshire (12,400) and Maine (22,500
State Table (Ranked by Number of Homes at Risk)
|
Rank |
State |
Extreme |
Very High |
High |
Moderate |
Low* |
Total |
|
1 |
Florida |
793,204 |
461,632 |
524,923 |
352,102 |
377,951 |
2,509,812 |
|
2 |
Louisiana |
97,760 |
104,059 |
337,495 |
138,762 |
82,196 |
760,272 |
|
3 |
New York |
127,325 |
114,876 |
131,039 |
91,294 |
N/A |
464,534 |
|
4 |
New Jersey |
116,581 |
178,668 |
73,303 |
77,596 |
N/A |
446,148 |
|
5 |
Texas |
45,800 |
70,894 |
112,189 |
116,168 |
96,253 |
441,304 |
|
6 |
Virginia |
94,260 |
115,770 |
98,463 |
84,015 |
27,544 |
420,052 |
|
7 |
South Carolina |
107,443 |
57,327 |
65,885 |
46,799 |
30,961 |
308,415 |
|
8 |
North Carolina |
73,463 |
51,927 |
48,595 |
40,155 |
37,347 |
251,487 |
|
9 |
Massachusetts |
31,420 |
65,279 |
74,413 |
49,325 |
N/A |
220,437 |
|
10 |
Maryland |
47,990 |
39,966 |
27,591 |
28,975 |
N/A |
144,522 |
|
11 |
Georgia |
41,970 |
52,281 |
28,852 |
19,190 |
8,465 |
150,758 |
|
12 |
Pennsylvania |
1,467 |
45,776 |
37,983 |
32,426 |
N/A |
117,652 |
|
13 |
Mississippi |
14,809 |
20,643 |
29,387 |
27,507 |
10,588 |
102,934 |
|
14 |
Connecticut |
25,292 |
23,656 |
22,230 |
26,529 |
N/A |
97,707 |
|
15 |
Alabama |
7,403 |
12,707 |
10,182 |
13,749 |
14,086 |
58,127 |
|
16 |
Delaware |
11,523 |
10,854 |
13,528 |
13,811 |
N/A |
49,716 |
|
17 |
Rhode Island |
6,595 |
5,988 |
6,720 |
7,187 |
N/A |
26,490 |
|
18 |
Maine |
5,159 |
2,753 |
7,368 |
7,211 |
N/A |
22,491 |
|
19 |
New Hampshire |
2,514 |
3,470 |
4,234 |
2,272 |
N/A |
12,490 |
|
20 |
District of Columbia |
N/A** |
N/A** |
545 |
3,123 |
N/A |
3,668 |
|
Total |
1,651,978 |
1,438,526 |
1,654,925 |
1,178,196 |
685,391 |
6,609,016 |
* The "Low" risk category is based on Category 5 hurricanes, which are not likely along the northeastern Atlantic coast. States in that area have N/A designated for the Low category due to the extremely low probability of a Category 5 storm affecting that area.
** Washington, D.C. has no Atlantic coastal properties, but can be affected by larger hurricanes that push storm surge into the Potomac River. Category 1 and 2 storms will likely not generate sufficient storm surge to affect properties in Washington, D.C.
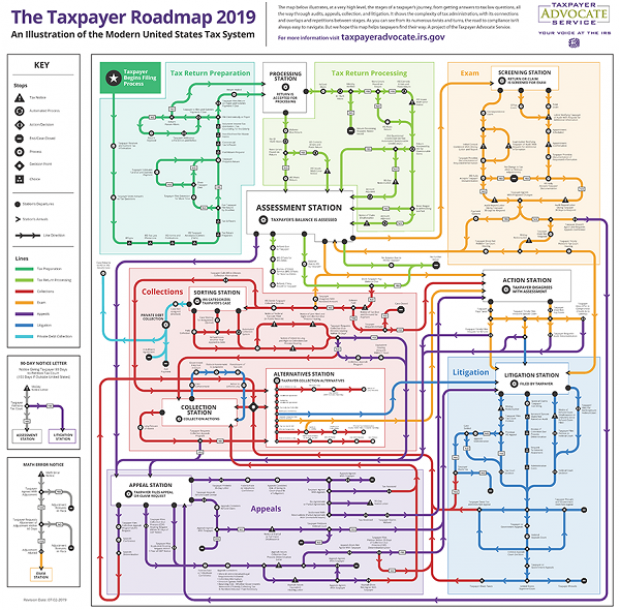
Map of the Day: Navigating the IRS

The Taxpayer Advocate Service – an independent organization within the IRS whose roughly 1,800 employees both assist taxpayers in resolving problems with the tax collection agency and recommend changes aimed at improving the system – released a “subway map” that shows the “the stages of a taxpayer’s journey.” The colorful diagram includes the steps a typical taxpayer takes to prepare and file their tax forms, as well as the many “stations” a tax return can pass through, including processing, audits, appeals and litigation. Not surprisingly, the map is quite complicated. Click here to review a larger version on the taxpayer advocate’s site.
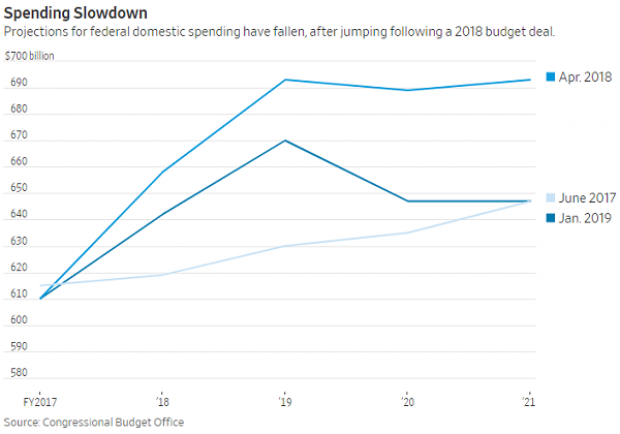
A Surprise Government Spending Slowdown
")
Economists expected federal spending to boost growth in 2019, but some of the fiscal stimulus provided by the 2018 budget deal has failed to show up this year, according to Kate Davidson of The Wall Street Journal.
Defense spending has come in as expected, but nondefense spending has lagged, and it’s unlikely to catch up to projections even if it accelerates in the coming months. Lower spending on disaster relief, the government shutdown earlier this year, and federal agencies spending less than they have been given by Congress all appear to be playing a role in the spending slowdown, Davidson said.
Number of the Day: $203,500

The Wall Street Journal’s Catherine Lucey reports that acting White House Chief of Staff Mick Mulvaney is making a bit more than his predecessors: “The latest annual report to Congress on White House personnel shows that President Trump’s third chief of staff is getting an annual salary of $203,500, compared with Reince Priebus and John Kelly, each of whom earned $179,700.” The difference is the result of Mulvaney still technically occupying the role of director of the White House Office of Management and Budget, where his salary level is set by law.
The White House told the Journal that if Mulvaney is made permanent chief of staff his salary would be adjusted to the current salary for an assistant to the president, $183,000.
The Census Affects Nearly $1 Trillion in Spending

The 2020 census faces possible delay as the Supreme Court sorts out the legality of a controversial citizenship question added by the Trump administration. Tracy Gordon of the Tax Policy Center notes that in addition to the basic issue of political representation, the decennial population count affects roughly $900 billion in federal spending, ranging from Medicaid assistance funds to Section 8 housing vouchers. Here’s a look at the top 10 programs affected by the census:
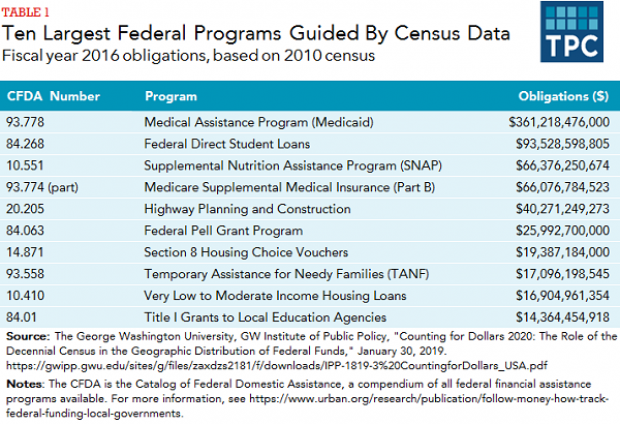
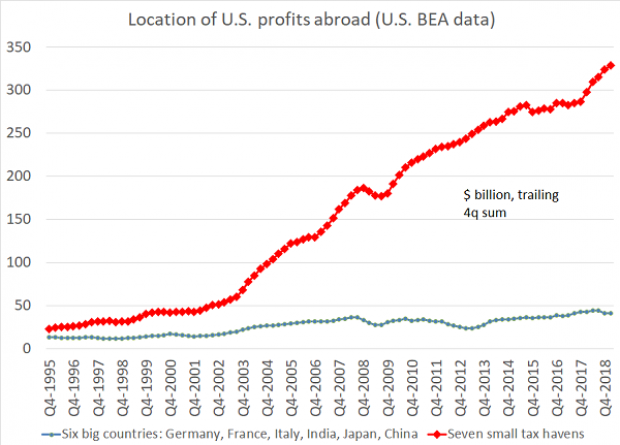
Chart of the Day: Offshore Profits Continue to Rise

Brad Setser, a former U.S. Treasury economist now with the Council on Foreign Relations, added another detail to his assessment of the foreign provisions of the Tax Cuts and Jobs Act: “A bit more evidence that Trump's tax reform didn't change incentives to offshore profits: the enormous profits that U.S. firms report in low tax jurisdictions continues to rise,” Setser wrote. “In fact, there was a bit of a jump up over the course of 2018.”