The New Spider-Man: Sony and Marvel Bet Big on Tom Holland
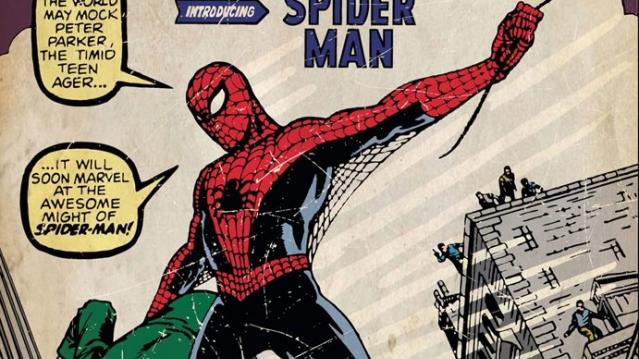
After much speculation and debate, Marvel has finally revealed who will play Peter Parker in its next Spider-Man reboot — and it’s not a name you’ll be likely to recognize: 19-year-old Tom Holland.
Who? Exactly.
Significantly more cherubic than the last two stars cast in the role — Tobey Maguire and Andrew Garfield — Holland appeared in the 2012 movie The Impossible and had a stint in the title role of the London production of Billy Elliott. Now he’ll be the web-slinging superhero, starting with a relatively small role in next year’s Captain America: Civil War and then in an as-yet-unnamed Spider-Man movie.
Marvel had said they would be casting someone more in line with Spidey’s actual age. In the comics and films, Parker is ostensibly an 18-year-old high school senior, but Maguire was 27 when he first donned the mask, while Garfield was 28.
Related: Sony Spins a New Spider-Man Strategy with Disney
The very fact that Marvel was able to cast anyone in the role at all was thanks to a protracted negotiations with Spider-Man’s cinematic rights-holder, Sony. Finally clinching this deal allows Marvel to bring have Spider-Man play his pivotal and necessary role in Civil War, a comic-book story arc adored by critics and fans alike.
But as much as fans might have riding on Holland’s Spider-Man, Marvel and Sony are counting on him even more: They’re effectively betting hundreds of millions of dollars on the little-known actor, and hoping he can breathe new life into a franchise that, while is generated $1.5 billion in U.S. box office sales and about $4 billion worldwide, has seen dwindling returns over time.
The first Spider-Man movie starring Holland is slated to be released on July 28, 2017.
Spider-Man (2002): $403,706,375
Spider-Man 2 (2004): $373,585,825
Spider-Man 3 (2007): $336,530,303
The Amazing Spider-Man (2012): $262,030,663
The Amazing Spider-Man 2 (2014): $202,853,933
Tax Refunds Rebound
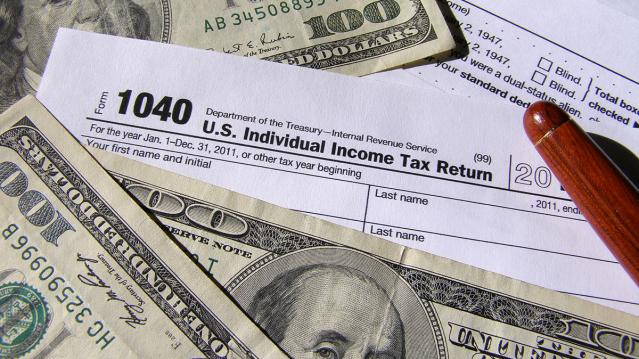
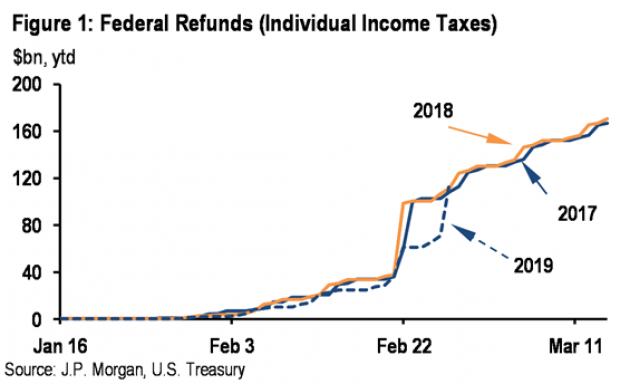
Smaller refunds in the first few weeks of the current tax season were shaping up to be a political problem for Republicans, but new data from the IRS shows that the value of refund checks has snapped back and is now running 1.3 percent higher than last year. The average refund through February 23 last year was $3,103, while the average refund through February 22 of 2019 was $3,143 – a difference of $40. The chart below from J.P. Morgan shows how refunds performed over the last 3 years.
Number of the Day: $22 Trillion
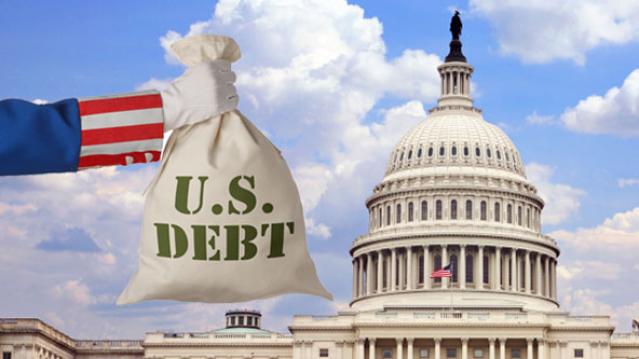
The total national debt surpassed $22 trillion on Monday. Total public debt outstanding reached $22,012,840,891,685.32, to be exact. That figure is up by more than $1.3 trillion over the past 12 months and by more than $2 trillion since President Trump took office.
Chart of the Week: The Soaring Cost of Insulin
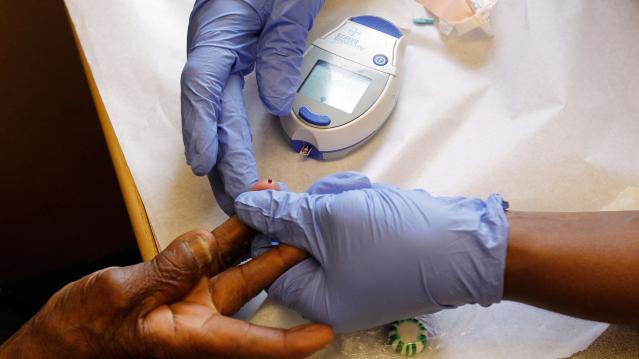
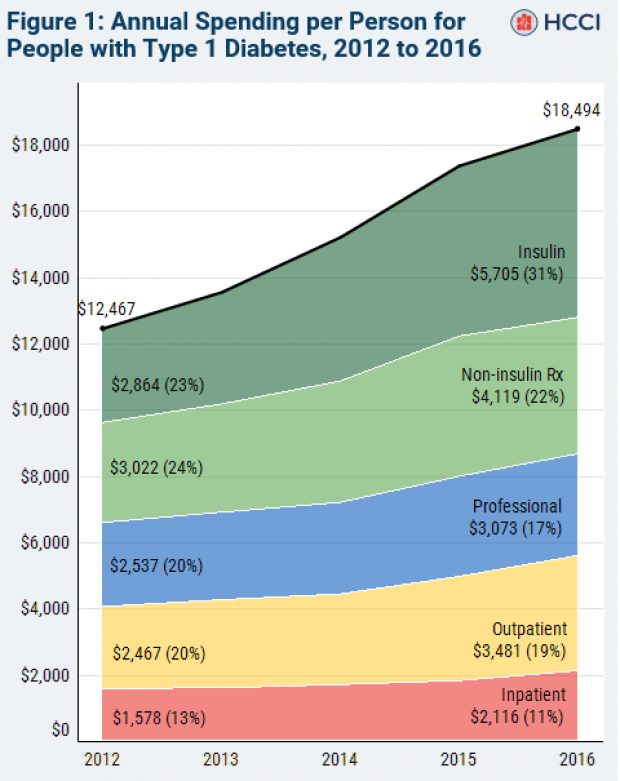
The cost of insulin used to treat Type 1 diabetes nearly doubled between 2012 and 2016, according to an analysis released this week by the Health Care Cost Institute. Researchers found that the average point-of-sale price increased “from $7.80 a day in 2012 to $15 a day in 2016 for someone using an average amount of insulin (60 units per day).” Annual spending per person on insulin rose from $2,864 to $5,705 over the five-year period. And by 2016, insulin costs accounted for nearly a third of all heath care spending for those with Type 1 diabetes (see the chart below), which rose from $12,467 in 2012 to $18,494.
Chart of the Day: Shutdown Hits Like a Hurricane

The partial government shutdown has hit the economy like a hurricane – and not just metaphorically. Analysts at the Committee for a Responsible Federal Budget said Tuesday that the shutdown has now cost the economy about $26 billion, close to the average cost of $27 billion per hurricane calculated by the Congressional Budget Office for storms striking the U.S. between 2000 and 2015. From an economic point of view, it’s basically “a self-imposed natural disaster,” CRFB said.
Chart of the Week: Lowering Medicare Drug Prices

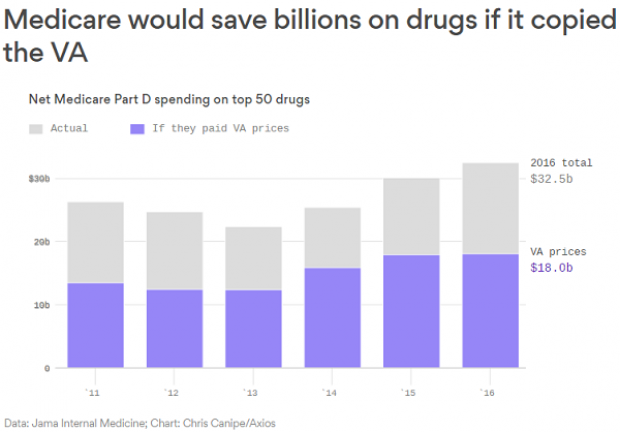
The U.S. could save billions of dollars a year if Medicare were empowered to negotiate drug prices directly with pharmaceutical companies, according to a paper published by JAMA Internal Medicine earlier this week. Researchers compared the prices of the top 50 oral drugs in Medicare Part D to the prices for the same drugs at the Department of Veterans Affairs, which negotiates its own prices and uses a national formulary. They found that Medicare’s total spending was much higher than it would have been with VA pricing.
In 2016, for example, Medicare Part D spent $32.5 billion on the top 50 drugs but would have spent $18 billion if VA prices were in effect – or roughly 45 percent less. And the savings would likely be larger still, Axios’s Bob Herman said, since the study did not consider high-cost injectable drugs such as insulin.

