Why We All Buy Tide: The 10 Biggest Advertisers in the U.S.

The 200 top national advertisers spent a record $137.8 billion last year trying to get you to buy more of their goods and services, an increase of 2 percent over 2013, according to Ad Age’s latest annual spending review.
That total was slightly more than the GDP of Hungary last year, but the growth rate was the lowest since 2009, as advertisers looked to get the most for their money. Internet display advertising among those 200 marketing Goliaths dropped by 13.3 percent.
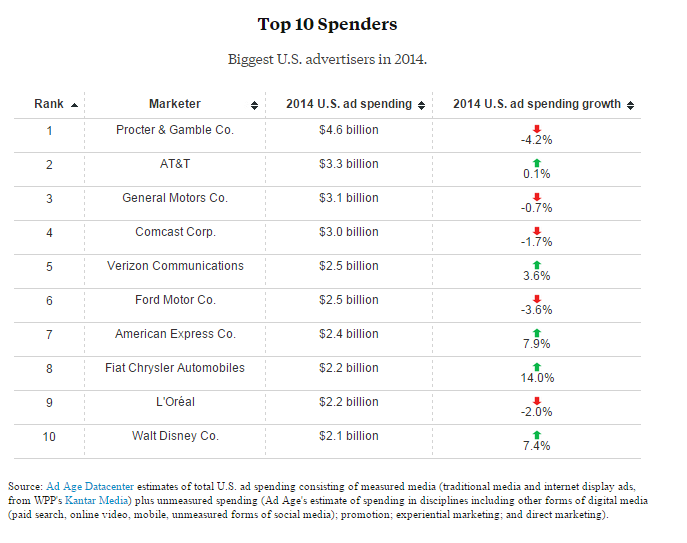
Overall, 38 marketers spent more than $1 billion on advertising last year. Procter & Gamble remains the country’s (and the world’s) largest advertiser. It shelled out $4.6 billion in the U.S. alone to promote brands such as Crest, Duracell, Pampers and Tide — or well over $1 billion more than the next biggest spender. P&G’s CFO recently revealed plans to cut ad spending by as much as $500 million, though.
Here’s Ad Age’s list of the 10 biggest advertisers in the U.S. last year:
Coming Soon: Deductible Relief Day!

You may be familiar with the concept of Tax Freedom Day – the date on which you have earned enough to pay all of your taxes for the year. Focusing on a different kind of financial burden, analysts at the Kaiser Family Foundation have created Deductible Relief Day – the date on which people in employer-sponsored insurance plans have spent enough on health care to meet the average annual deductible.
Average deductibles have more than tripled over the last decade, forcing people to spend more out of pocket each year. As a result, Deductible Relief Day is “getting later and later in the year,” Kaiser’s Larry Levitt said in a tweet Thursday.

Chart of the Day: Families Still Struggling

Ten years into what will soon be the longest economic expansion in U.S. history, 40% of families say they are still struggling, according to a new report from the Urban Institute. “Nearly 4 in 10 nonelderly adults reported that in 2018, their families experienced material hardship—defined as trouble paying or being unable to pay for housing, utilities, food, or medical care at some point during the year—which was not significantly different from the share reporting these difficulties for the previous year,” the report says. “Among adults in families with incomes below twice the federal poverty level (FPL), over 60 percent reported at least one type of material hardship in 2018.”

Chart of the Day: Pragmatism on a Public Option

A recent Morning Consult poll 3,073 U.S. adults who say they support Medicare for All shows that they are just as likely to back a public option that would allow Americans to buy into Medicare or Medicaid without eliminating private health insurance. “The data suggests that, in spite of the fervor for expanding health coverage, a majority of Medicare for All supporters, like all Americans, are leaning into their pragmatism in response to the current political climate — one which has left many skeptical that Capitol Hill can jolt into action on an ambitious proposal like Medicare for All quickly enough to wrangle the soaring costs of health care,” Morning Consult said.

Chart of the Day: The Explosive Growth of the EITC

The Earned Income Tax Credit, a refundable tax credit for low- to moderate-income workers, was established in 1975, with nominal claims of about $1.2 billion ($5.6 billion in 2016 dollars) in its first year. According to the Tax Policy Center, by 2016 “the total was $66.7 billion, almost 12 times larger in real terms.”

Chart of the Day: The Big Picture on Health Care Costs

“The health care services that rack up the highest out-of-pocket costs for patients aren't the same ones that cost the most to the health care system overall,” says Axios’s Caitlin Owens. That may distort our view of how the system works and how best to fix it. For example, Americans spend more out-of-pocket on dental services ($53 billion) than they do on hospital care ($34 billion), but the latter is a much larger part of national health care spending as a whole.
