Here’s the Scoop: Fun Facts for National Ice Cream Day

When President Ronald Reagan in 1984 designated the month of July as National Ice Cream Month and declared the third Sunday of July as National Ice Cream Day, he probably never could have foreseen a time when flavors of the treat included Pork Rind, Strawberry Durian or Squid.
Ice cream shops around the country will be celebrating their special day again this Sunday, July 19. Carvel stores will be offering a buy-one-get-one-free deal on any size or flavor of soft-serve cones. Friendly’s is celebrating its 80th birthday this weekend, with participating stores also offering buy-one-get-one-free deals. Baskin-Robbins is offering a free upgrade to waffle cones with double scoops during the entire month of July. It also will offer 31 percent off all its ice cream sundaes on Friday, July 31.
Related: Born in the USA: 24 Iconic American Foods
Those chains offer a wide variety of flavors, but probably nothing quite as exotic as the OddFellows Ice Cream Co. in New York City, known for formulations loaded with unusual ingredients: Edamame, Chorizo Caramel Swirl, Cornbread and Maple Bacon Pecan. OddFellows co-owner Mohan Kumar says National Ice Cream Day will be just a regular Sunday for him and his stores: “It’s a beautiful day for ice cream every day.”
As you consider indulging in a frozen snack, here are some fun facts to fuel our red hot passion for ice cream:
Who Screams for Ice Cream: California, Indiana, Pennsylvania, Texas and New York are the states that consume the most ice cream. California also produces the most ice cream—over 142,000 gallons every year. About 10.3 percent of all the milk produced by U.S. dairy farmers is used to make ice cream. The five most popular brands in the U.S. are private labels, followed by Blue Bell, Haagen-Dazs, Breyers and Ben & Jerry’s. According to the International Dairy Foods Association, vanilla is America’s favorite flavor of ice cream, followed by chocolate. And how’s this for being ice cream crazy? Ben & Jerry’s employees get three free pints a day. They also get a free gym membership.
Hard Facts About Soft Serve: Despite many headlines to the contrary, it does not look like former British Prime Minister Margaret Thatcher invented soft-serve ice cream before she became known as the Iron Lady. The honor instead goes to Tom Carvel of Carvel ice cream or Dairy Queen co-founder J. F. McCullough. In Carvel’s case, his ice cream truck got a flat tire in Hartsdale, New York, in 1934. As the ice cream started to melt, he noticed its soft, creamy consistency and began selling it right from the truck. Two years later, he opened his first Carvel shop at the site where the truck first broke down.
Related: The 9 Most Expensive Junk Foods
Why We’re All Coneheads: Italo Marchiony, an Italian immigrant, was granted a patent for waffle-like ice cream cups in New York City in December 1903. But he may not be the father of the cones we enjoy today. As the story goes, Arnold Fornachou, an ice cream vendor at the 1904 World’s Fair in St. Louis, ran out of dishes. His neighbor, a Syrian man, was selling crisp, Middle Eastern pastries called Zalabias. When rolled up, the waffle-like Zalabias made a perfect cone to hold the ice cream. The International Association of Ice Cream Manufacturers and the International Dairy Foods Association credit Ernest A. Hamwi, the pastry maker, with creating the cone, but others have also claimed credit — including Abe Doumar, another Syrian immigrant at the 1904 fair who would go on to produce the first machine to mass-produce ice cream waffle cones.
The Rapidly Rising Death Toll of the Heroin Epidemic
The death toll from the heroin epidemic has been climbing dramatically in recent years — and the annual rate of overdose deaths nearly doubled between 2011 and 2013, according to a new CDC study.
From 2002 through 2013, heroin use in the United States rose by 63 percent, and the rate of abuse or dependence climbed a staggering 90 percent. Deaths from heroin-related overdoses nearly quadrupled, with more than 8,200 people dying in 2013 alone.
The CDC report says that heroin use has increased across most demographic groups — men and women, most age groups, and across all income levels. Rates of heroin use are still highest among men, those ages 18 to 25, people with income less than $20,000 a year, people in urban areas, and those who do not have health insurance or are on Medicaid. But other groups are turning to the drug, too. “Some of the greatest increases occurred in demographic groups with historically low rates of heroin use: women, the privately insured and people with higher incomes,” the CDC says.

The heroin trend isn’t happening in isolation, the CDC study says. Almost all heroin users — 96 percent — also took at least one other drug, and 61 percent used at least three other drugs. Abuse or dependence on opioid painkillers is the strongest risk-factor for heroin use or addiction, the report says, with cocaine addiction also high on the list. People who are addicted to prescription opioid painkillers are 40 times more likely to use or be addicted to heroin, and 45 percent of people who used heroin were also addicted to painkillers.
Another key reason is that heroin is becoming cheaper and more widely available. According to the DEA, the increase in heroin seizures in the U.S. from 2010 and 2014 rose 81 percent, from 2,763 kilograms to 5,014 kilograms. More and more law enforcement agencies are identifying heroin as their primary drug threat, but the CDC report suggests that health care workers focus on reducing the abuse of painkillers by improving prescribing practices.
The study also recommends that states increase access to “medication-assisted treatment” programs that use methadone, buprenorphine and naltrexone along with behavioral counseling. And it says the rapid rise in heroin-related deaths highlights an “urgent need” to broaden access to naloxone, a drug that can reverse the effects of heroin and opioid overdose.
Here’s Why Economists Are Worried About A New Housing Bubble

After posting their 39th consecutive month of year-over-year price gains, home prices in 33 states and the District of Columbia are at or within 10 percent of record highs, according to a report issued today by CoreLogic.
Home prices increased 6.3 percent year-over-year in May, and 1.7 percent month-over-month. Relatively low mortgage rates have helped fuel the price gains. In cities like San Francisco, where there is limited supply and high demand, prices are growing at a double-digit clip.
Prices are so high in certain areas that some economists are starting to worry about localized bubbles. The number of homes on the market is increasing slightly. Total housing inventory at the end of may reached 2.29 million houses, 1.8 percent more than this time last year, according to the National Association of Realtors. That’s a 5.1-month supply, giving sellers a slight edge in today’s market. (A six-month supply is considered a healthy market.)
Related: Get ready for Another Real Estate Bubble
South Carolina saw the biggest price gains, with homes showing annual appreciation of 10.3 percent. Other states showing big gains were Colorado (9.8 percent) and Washington (8.8 percent), CoreLogic reports.
High prices have also spurred builders to start constructing new single-family homes, sales of which increased 23 percent year-over-year in May.
While most states have seen price gains, five states (Massachusetts, Connecticut, Maryland, Mississippi, and Louisiana) saw local home prices fall in May.
CoreLogic economists expect prices to increase 5.1 percent year-over-year in June and 0.8 percent month to month.
Looking for Likes? When to Post on Facebook for Maximum Attention

Trying to decide when to post photo updates to your “Summer 2015” album so the maximum number of people click through, comment on, and like your filtered selfies? Look no further. A new study conducted by the social media analytics firm Klout can tell you the best time and day of the week to post on Facebook and Twitter, depending where you are in the world.
The study found that posting in the late morning and early afternoons on Tuesdays and Wednesdays tends to generate the most engagement. Thursdays tend to be quiet, Fridays are quieter still, and the weekends are the quietest. On Mondays, the activity level begins to ramp up again as the work week begins and bored office workers take social media breaks.
Optimal times also depend on location. Tokyo peaks at the earliest time among cities studied, between 7 a.m. and 9 a.m. Paris has a high level of engagement once in the morning and once in the afternoon. In San Francisco, between 9 a.m. and 10 a.m. is ideal for posting. The most favorable time in New York is just before noon. London peaks the latest, with users becoming fully engaged on Twitter and Facebook only in the early afternoon.
Thinking about posting a picture of your cute new nephew at night? Don’t even bother if you want maximum engagement from your followers and friends. While one explanation is that fewer people are online at night, another is that most likes, shares, and comments occur within a short window of time after someone posts something. Researchers of the study found the majority of reactions were within the first two hours of posting time.
Using a sample set of half a million active users and more than 25 million messages over 56 days, the report boasts a reaction gain of up to 4 percent on Twitter and 17 percent on Facebook when the recommended posting times are used.
Why We All Buy Tide: The 10 Biggest Advertisers in the U.S.
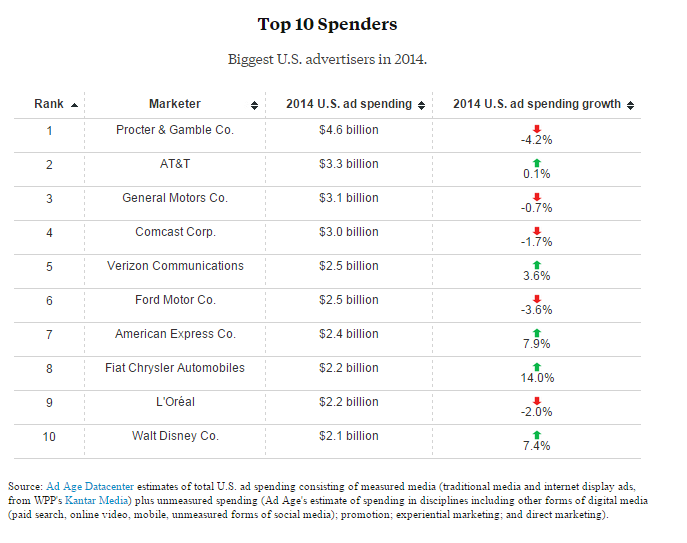
The 200 top national advertisers spent a record $137.8 billion last year trying to get you to buy more of their goods and services, an increase of 2 percent over 2013, according to Ad Age’s latest annual spending review.
That total was slightly more than the GDP of Hungary last year, but the growth rate was the lowest since 2009, as advertisers looked to get the most for their money. Internet display advertising among those 200 marketing Goliaths dropped by 13.3 percent.
Overall, 38 marketers spent more than $1 billion on advertising last year. Procter & Gamble remains the country’s (and the world’s) largest advertiser. It shelled out $4.6 billion in the U.S. alone to promote brands such as Crest, Duracell, Pampers and Tide — or well over $1 billion more than the next biggest spender. P&G’s CFO recently revealed plans to cut ad spending by as much as $500 million, though.
Here’s Ad Age’s list of the 10 biggest advertisers in the U.S. last year:
Why More Workers Are Saying ‘No Thanks’ to a Full-Time Job

After years of keeping a conservative head count, companies have finally started to hire workers again. But they may find that many workers aren’t interested in becoming full-time employees anymore.
Related: 6 Secrets of Successful Freelancers
The number of independent workers increased by 12 percent in the past five years, and nearly 80 percent of those who work for themselves plan on remaining independent, according to a new report by MBO Partners. One in seven non-independent workers is considering going freelance.
Nearly 80 percent of freelance workers say that they’re happier working for themselves, thanks to the flexibility of being their own boss. Plus, they’re earning decent money.
More than a quarter of independent workers earn more than $75,000 per year, and the number making more than $100,000 per year has surged by 45 percent to almost 3 million.
The majority of today’s freelancers have actively chosen to go independent. Technology has made the shift easier, and Obamacare has made it possible for independent workers to secure health benefits for themselves and their families. However, they may be slacking when it comes to retirement planning. Seven in 10 self-employer people don’t save for retirement regularly, according to a separate report from TD Ameritrade.
Related: The 10 Best Cities for Summer Travelers
The number of full-time, independent workers now totals nearly 18 million Americans, with another 12.5 million who doing contract work part-time. Independent workers say they feel more secure working freelance, thanks to an average of four or more revenue streams, according to the MBO Partners report.