The Most Expensive Cities for Singles -- and the Cheapest

Looking for love in all the pricey places? Check out these lists of the most and least expensive cities for singles before you go on that next date or plan your next move. Looking good doesn’t come cheap, and the price of a decent wardrobe and a gym membership add ups before you even step out the door.
To determine which cities were the least and most affordable for singles, GoBankingRates examined 89 cities and rated them according to four expense categories -- clothing, dates, gym memberships and rent -- using data from Numbeo.com. “Singles are more likely to exercise, and to have a gym membership,” says Elyssa Kirkham, a finance writer for GoBankingRates. “They’re more likely to rent than own a home, and spend more money on dates and clothing.”
Related: Hot New Dating Criteria: What’s Your Credit Score?
San Francisco is the most expensive city for singles, especially when it comes to rent. Rent is 30 percent more expensive in San Francisco than it is in Honolulu. The cost of a date here is $147, compared with the median cost of $109. California just might be the most expensive state to date in, claiming seven of the top 15 spots: San Francisco, Fremont, Glendale, Irvine, Los Angeles, San Diego and Oakland.
The second most expensive city? New York City, which boasts the most expensive gym membership at $90 per month. Clothing costs here are the second-highest in the nation -- bad news for all the Carrie Bradshaws out there. And date night will set you back $145.
The most expensive date night in the country is in Washington, D.C., which came in third overall. Date night in our nation’s capital costs $166 for dinner, a bottle of wine, two movie tickets and a 10-mile taxi ride. Compare that to Chattanooga, Tennessee, which had the cheapest date night at $78.
Looking for more bang for your buck? Move to Reno, Nevada. Rent here is just 86 cents per square foot, and a night out averages $97.30. Keep in mind, though, that “the Biggest Little City in the World” was once known as the divorce capital of the world, so dating there may offer less promise than other locales.
Related: The Bad News About All the Singles in America
Most Expensive Cities for Singles
- San Francisco
- New York
- Washington, D.C.
- Honolulu
- Boston
- Fremont, California
- Glendale, California
- Anchorage, Alaska
- Miami
- Seattle
- Irvine, California
- Los Angeles
- San Diego
- Oakland, California
- Madison, Wisconsin
Related: Marriage?? Young Americans Aren’t Even Shacking Up
15 Cheapest Cities for Singles
- Reno, Nevada
- Tucson, Arizona
- Grand Rapids, Michigan
- Tacoma, Washington
- Indianapolis
- Mesa, Arizona
- Little Rock, Arkansas
- Albuquerque, New Mexico
- Huntsville, Alabama
- Memphis, Tennessee
- St. Louis, Missouri
- Jackson, Mississippi
- Stockton, California
- Omaha, Nebraska
- Chattanooga, Tennessee
Chart of the Day: SALT in the GOP’s Wounds
The stark and growing divide between urban/suburban and rural districts was one big story in this year’s election results, with Democrats gaining seats in the House as a result of their success in suburban areas. The GOP tax law may have helped drive that trend, Yahoo Finance’s Brian Cheung notes.
The new tax law capped the amount of state and local tax deductions Americans can claim in their federal filings at $10,000. Congressional seats for nine of the top 25 districts where residents claim those SALT deductions were held by Republicans heading into Election Day. Six of the nine flipped to the Democrats in last week’s midterms.
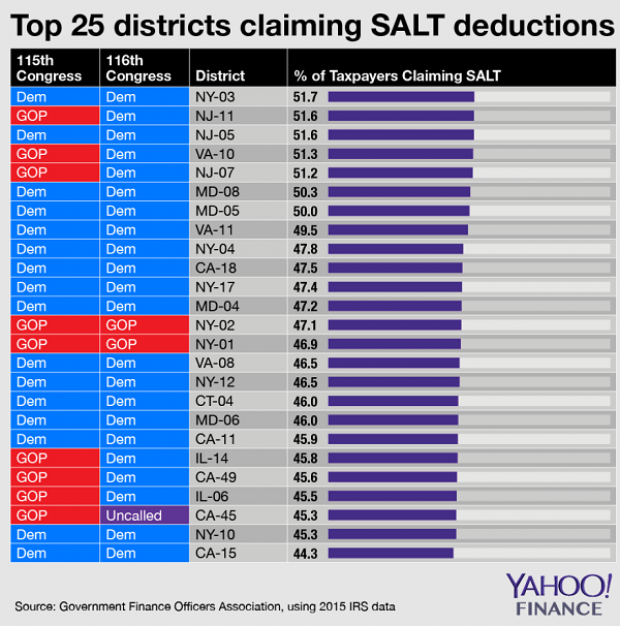
Chart of the Day: Big Pharma's Big Profits
Ten companies, including nine pharmaceutical giants, accounted for half of the health care industry's $50 billion in worldwide profits in the third quarter of 2018, according to an analysis by Axios’s Bob Herman. Drug companies generated 23 percent of the industry’s $636 billion in revenue — and 63 percent of the total profits. “Americans spend a lot more money on hospital and physician care than prescription drugs, but pharmaceutical companies pocket a lot more than other parts of the industry,” Herman writes.
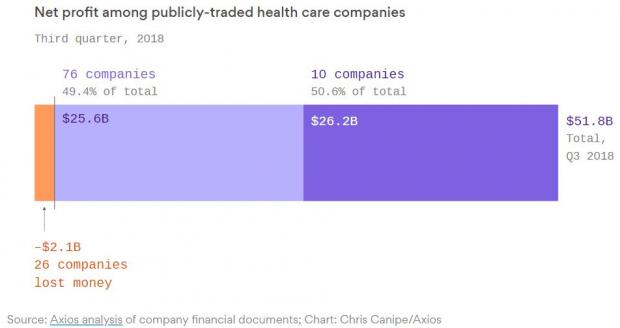
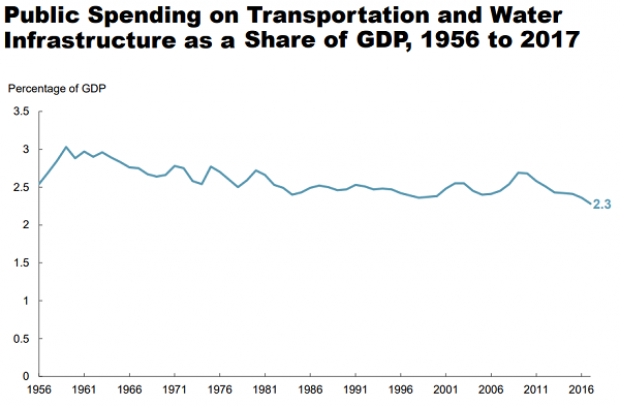
Chart of the Day: Infrastructure Spending Over 60 Years

Federal, state and local governments spent about $441 billion on infrastructure in 2017, with the money going toward highways, mass transit and rail, aviation, water transportation, water resources and water utilities. Measured as a percentage of GDP, total spending is a bit lower than it was 50 years ago. For more details, see this new report from the Congressional Budget Office.
Number of the Day: $3.3 Billion
The GOP tax cuts have provided a significant earnings boost for the big U.S. banks so far this year. Changes in the tax code “saved the nation’s six biggest banks $3.3 billion in the third quarter alone,” according to a Bloomberg report Thursday. The data is drawn from earnings reports from Bank of America, Citigroup, Goldman Sachs, JPMorgan Chase, Morgan Stanley and Wells Fargo.
Clarifying the Drop in Obamacare Premiums
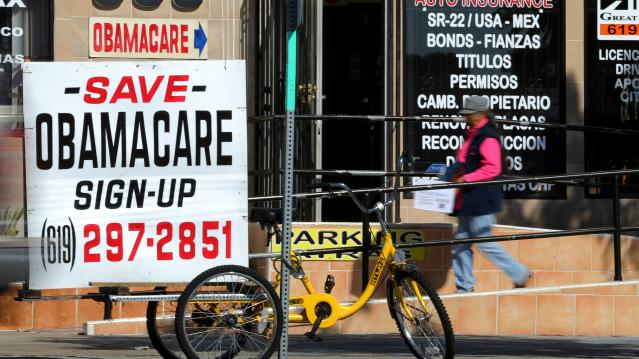
We told you Thursday about the Trump administration’s announcement that average premiums for benchmark Obamacare plans will fall 1.5 percent next year, but analyst Charles Gaba says the story is a bit more complicated. According to Gaba’s calculations, average premiums for all individual health plans will rise next year by 3.1 percent.
The difference between the two figures is produced by two very different datasets. The Trump administration included only the second-lowest-cost Silver plans in 39 states in its analysis, while Gaba examined all individual plans sold in all 50 states.