Here’s Why Americans Are Keeping Their Cars Longer than Ever
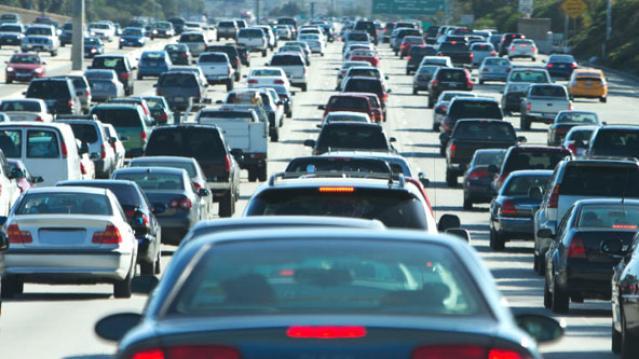
As cars get more reliable Americans are holding onto their vehicles for longer than ever before. The average age of cars and light trucks is now 11.5 years old, according to a new report from IHS Automotive.
In addition to better reliability, cars are getting older because Americans bought far fewer new cars in the years following the Great Recession, as concerns lingered about unemployment and the strength of the economy.
Even as consumers have started purchasing new vehicles again, they’re still holding onto their older ones. The average length of ownership of a new vehicle reached 6.5 years in the first quarter of 2015, more than two years longer than in 2006. The number of cars more than 12 years old continues to grow and is expected to increase 15 percent by 2020.
Related: The Incredible Disappearing American-Made Car
IHS predicts that the average age of vehicles will inch up slightly over the next few years, hitting 11.7 years in 2018.
The number of cars on the road hit a record 258 million, posting a 2.1 percent increase over last year, driven by the purchase of new cars. IHS expects that volume of cars less than 5 years old will increase by 24 percent over the next five years.
Consumer sales of autos were on pace to rise 4.2 percent this month, according to TrueCar, compared to July of 2014, thanks to increased demand, summer sales events and the growing popularity of premium brands.
Top Reads from The Fiscal Times:
- Why Hillary Clinton’s Tax Plan to Soak Investors Won’t Work
- US Health Spending: $3.1 Trillion a Year and Growing
- Joe Biden: The Looming Threat to a Republican Presidency
Coming Soon: Deductible Relief Day!

You may be familiar with the concept of Tax Freedom Day – the date on which you have earned enough to pay all of your taxes for the year. Focusing on a different kind of financial burden, analysts at the Kaiser Family Foundation have created Deductible Relief Day – the date on which people in employer-sponsored insurance plans have spent enough on health care to meet the average annual deductible.
Average deductibles have more than tripled over the last decade, forcing people to spend more out of pocket each year. As a result, Deductible Relief Day is “getting later and later in the year,” Kaiser’s Larry Levitt said in a tweet Thursday.

Chart of the Day: Families Still Struggling

Ten years into what will soon be the longest economic expansion in U.S. history, 40% of families say they are still struggling, according to a new report from the Urban Institute. “Nearly 4 in 10 nonelderly adults reported that in 2018, their families experienced material hardship—defined as trouble paying or being unable to pay for housing, utilities, food, or medical care at some point during the year—which was not significantly different from the share reporting these difficulties for the previous year,” the report says. “Among adults in families with incomes below twice the federal poverty level (FPL), over 60 percent reported at least one type of material hardship in 2018.”

Chart of the Day: Pragmatism on a Public Option

A recent Morning Consult poll 3,073 U.S. adults who say they support Medicare for All shows that they are just as likely to back a public option that would allow Americans to buy into Medicare or Medicaid without eliminating private health insurance. “The data suggests that, in spite of the fervor for expanding health coverage, a majority of Medicare for All supporters, like all Americans, are leaning into their pragmatism in response to the current political climate — one which has left many skeptical that Capitol Hill can jolt into action on an ambitious proposal like Medicare for All quickly enough to wrangle the soaring costs of health care,” Morning Consult said.

Chart of the Day: The Explosive Growth of the EITC

The Earned Income Tax Credit, a refundable tax credit for low- to moderate-income workers, was established in 1975, with nominal claims of about $1.2 billion ($5.6 billion in 2016 dollars) in its first year. According to the Tax Policy Center, by 2016 “the total was $66.7 billion, almost 12 times larger in real terms.”

Chart of the Day: The Big Picture on Health Care Costs

“The health care services that rack up the highest out-of-pocket costs for patients aren't the same ones that cost the most to the health care system overall,” says Axios’s Caitlin Owens. That may distort our view of how the system works and how best to fix it. For example, Americans spend more out-of-pocket on dental services ($53 billion) than they do on hospital care ($34 billion), but the latter is a much larger part of national health care spending as a whole.
