The Kids Aren’t Alright: More Millennials Are Living with Their Parents

Pity the millennial, poster child of the Great Recession. A popular meme portrays the typical millennial as a basement-dwelling economic loser, forever condemned to live in the nether regions of his parent’s house. Unfortunately, that meme is not without basis. The recession seem to have hit millennials particularly hard, making it even more difficult for young people to find good jobs and to establish their own households.
In some respects, things are looking up for millennials. The U.S. job market is strengthening, making it easier to find work, and wages are starting to creep higher. The unemployment rate for young adults (ages 18 to 34, excluding full-time college students) has been heading lower since peaking near 12 percent in 2010; the latest unemployment reading for millennials is 7.7 percent.
However, there is one notable sticking point, and it echoes that basement-dwelling meme. Even though household formation rates have rebounded overall, millennials are still not moving out and establishing their own households like they used to. In fact, more millennials are living with parents or relatives than before the recession, according to new research from Pew.
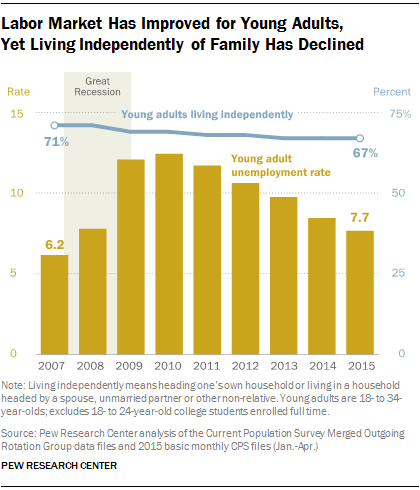
In 2007, before the recession hit, 71 percent of millennials were living independently. In 2015, that number has fallen to 67 percent, with no sign of bottoming.
On the flip side, 22 percent of young adults were living in their parents’ homes in 2007. That number has risen to 26 percent this year.
The Pew report doesn’t look at why millennials are sticking so close to home. However, it does suggest that the relatively simple economic argument about the lack of good jobs no longer tells the whole story. Since the economy is recovering, however unevenly, there are likely other factors in play. One could be cultural: More young people simply enjoy living at home and are in no hurry to move out. Perhaps the U.S. is becoming more like Italy, where adult children often live at home until they marry.
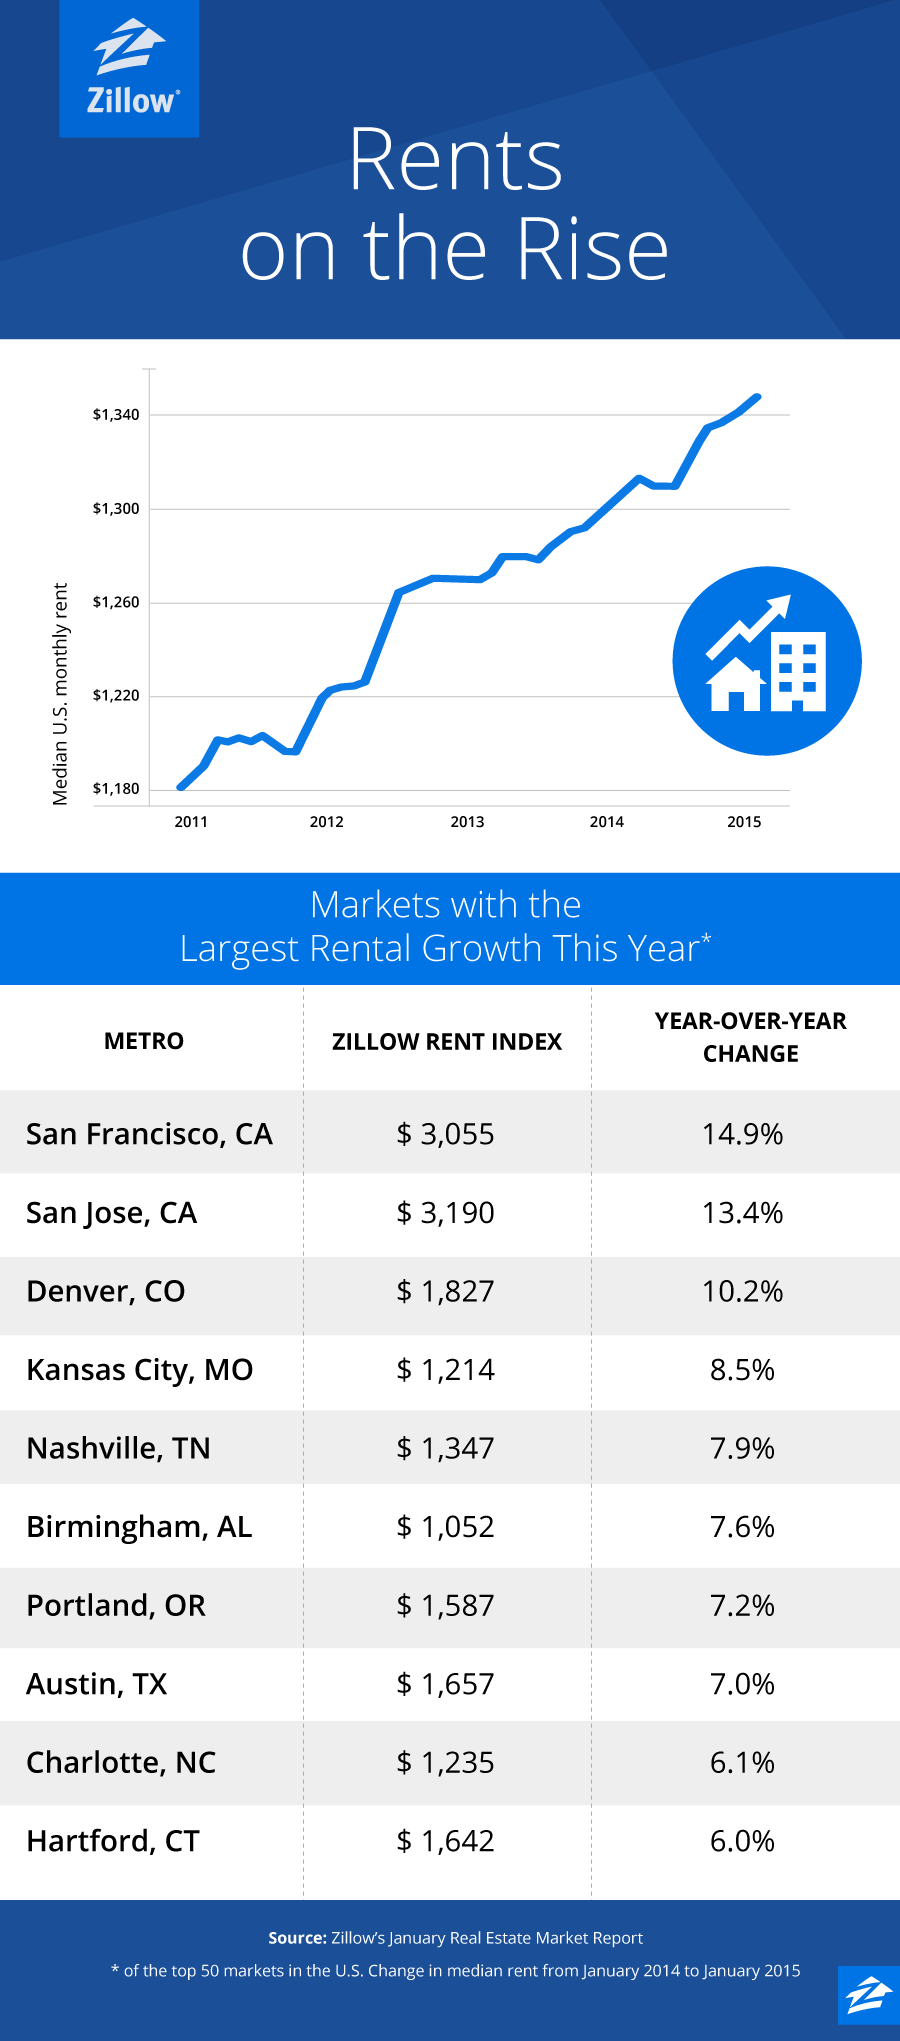
That’s not to say that money plays no role in the trend, though. One big economic factor not addressed in the Pew report is pretty basic: rising rents. This graphic from Zillow makes it clear that rents have been soaring all over the country. More than $3,000 for a one bedroom in San Francisco? With those kind of numbers, living at home makes all the sense in the world.
Tax Refunds Rebound

Smaller refunds in the first few weeks of the current tax season were shaping up to be a political problem for Republicans, but new data from the IRS shows that the value of refund checks has snapped back and is now running 1.3 percent higher than last year. The average refund through February 23 last year was $3,103, while the average refund through February 22 of 2019 was $3,143 – a difference of $40. The chart below from J.P. Morgan shows how refunds performed over the last 3 years.

Number of the Day: $22 Trillion

The total national debt surpassed $22 trillion on Monday. Total public debt outstanding reached $22,012,840,891,685.32, to be exact. That figure is up by more than $1.3 trillion over the past 12 months and by more than $2 trillion since President Trump took office.
Chart of the Week: The Soaring Cost of Insulin

The cost of insulin used to treat Type 1 diabetes nearly doubled between 2012 and 2016, according to an analysis released this week by the Health Care Cost Institute. Researchers found that the average point-of-sale price increased “from $7.80 a day in 2012 to $15 a day in 2016 for someone using an average amount of insulin (60 units per day).” Annual spending per person on insulin rose from $2,864 to $5,705 over the five-year period. And by 2016, insulin costs accounted for nearly a third of all heath care spending for those with Type 1 diabetes (see the chart below), which rose from $12,467 in 2012 to $18,494.

Chart of the Day: Shutdown Hits Like a Hurricane

The partial government shutdown has hit the economy like a hurricane – and not just metaphorically. Analysts at the Committee for a Responsible Federal Budget said Tuesday that the shutdown has now cost the economy about $26 billion, close to the average cost of $27 billion per hurricane calculated by the Congressional Budget Office for storms striking the U.S. between 2000 and 2015. From an economic point of view, it’s basically “a self-imposed natural disaster,” CRFB said.

Chart of the Week: Lowering Medicare Drug Prices

The U.S. could save billions of dollars a year if Medicare were empowered to negotiate drug prices directly with pharmaceutical companies, according to a paper published by JAMA Internal Medicine earlier this week. Researchers compared the prices of the top 50 oral drugs in Medicare Part D to the prices for the same drugs at the Department of Veterans Affairs, which negotiates its own prices and uses a national formulary. They found that Medicare’s total spending was much higher than it would have been with VA pricing.
In 2016, for example, Medicare Part D spent $32.5 billion on the top 50 drugs but would have spent $18 billion if VA prices were in effect – or roughly 45 percent less. And the savings would likely be larger still, Axios’s Bob Herman said, since the study did not consider high-cost injectable drugs such as insulin.
