For Most Seniors, Social Security Is Their Biggest Source of Income

The 80-year-old Social Security program has long been known as the third rail of American politics -- touch it and you die.
Last year alone, more than 59 million Americans received retirement, disability and survivor’s benefits totaling $863 billion. While some lawmakers and policy experts warn that the system will begin to run short of cash beginning in 2035, seniors’ advocacy groups have vigorously fought major changes and cuts.
Related: Battle Lines Form in the Fight Over Social Security Payment Reductions
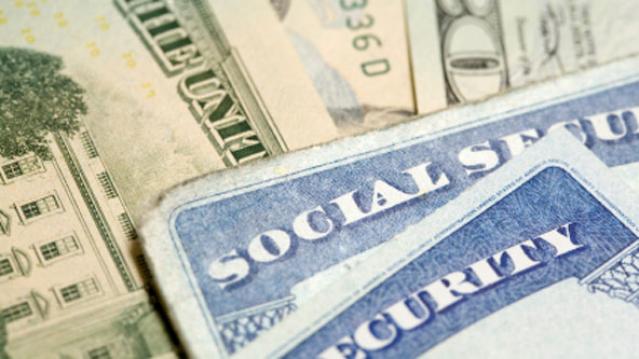
Some nine out of ten people who are 65 or older receive Social Security benefits, according to the Social Security Administration, with an average monthly benefit of $1,294 average for retirees. Overall, Social Security benefits constitute about 38 percent of the income of the elderly, but that number varies greatly from individual to individual.
For the majority of seniors, Social Security makes up the majority of their income. Sixty-five percent of beneficiaries age 65 and older get more than half of their income from the program. Nearly a third (28%) rely on Social Security for 90 percent or more of their income.
Related: 4 Ways to Fix Social Security
The pie chart below, prepared by the staff of the congressional Joint Economic Committee, illustrates the range of seniors’ dependence on Social Security benefits:

Dow Plunges into Correction Territory: Here’s How Bad Friday’s Market Bloodbath Was

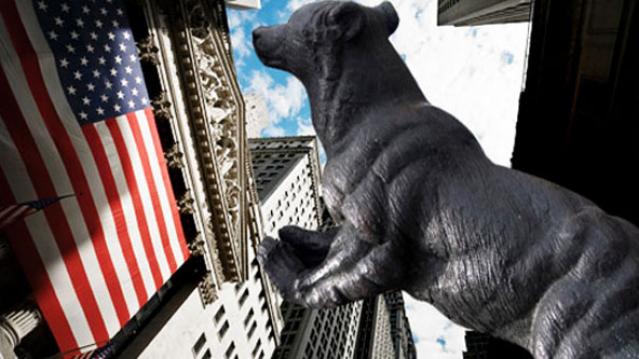
U.S. stocks closed sharply lower on Friday as slowing growth in China and worries about a possible rate hike by the Fed took their toll. The Dow Jones Industrial Average finished the day down 531 points for a 3.12 percent loss. The S&P lost 65 points (-3.16 percent) — its worst day since Aug. 8, 2011 — and the Nasdaq lost 171 (-3.52 percent). For the first time since 2011, the Dow is now in a correction, meaning it has lost 10 percent from its peak. The S&P is nearing correction territory, too, having lost 7.5 percent since its May 21 closing high.
Related: The Stock Market's Fed Fever Is Only Going to Get Worse
The selloff was widespread, with 491 of the S&P 500 stocks ending the day in the red and only 11 managing to advance (the S&P 500 actually includes 502 stocks). For the week, 487 of the S&P 500 stocks fell and only 15 gained. In total, the S&P 500 lost a collective $1.14 trillion in market value on the week. Yes, trillion with a "T."
This snapshot from finviz of the performance of stocks in the S&P 500 gives a sense of Friday's carnage (Click it to enlarge):
This Is America’s Favorite Credit Card

According to consumers, it does pay to Discover.
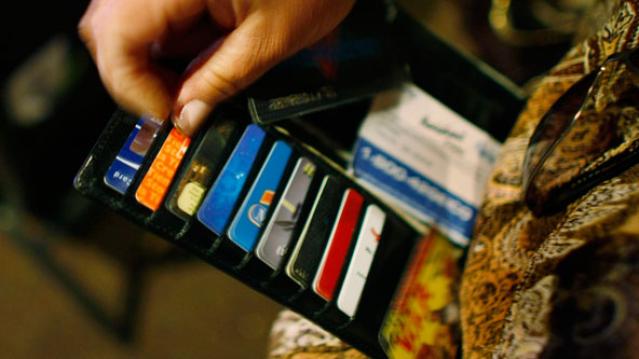
For the second year in a row, Discover has ranked the highest in customer satisfaction among credit card issuers, according to the results of a new survey by J.D. Power.
Discover received a score of 828 out of 1,000 in the survey, based on credit card terms, billing and payment, rewards, benefits and services, and problem resolution. American Express placed second with a score of 820, and Chase ranked third at 792.
Overall satisfaction with credit cards hit a record high of 790, up from 778 last year.
Related: 3 High-Tech Ideas to Fraud-Proof Our Credit Cards
Consumers were more likely to use their rewards last year, with more than half having done so in the past six months. That could be because rewards are getting better as banks get more creative with wooing and keeping customers, many of whom are still lukewarm about spending.
“When customers feel the rewards are attractive and when they redeem rewards more frequently, satisfaction improves, they spend more, and they are more likely to recommend the card to friends and family members,” Jim Miller, J.D. Power senior director of banking services, said in a statement.
Customers who redeem rewards spend an average of $1,128 per month, compared to $645 by those who don’t redeem rewards.
Even though they’re more satisfied with their credit cards, Americans are still concerned about ID theft. Less than a third of those surveyed felt their personal information was very secure, and just 16 percent thought that security had improved since last year.
Top Reads from the Fiscal Times:
- Trump: ‘I’ve Gained Such Respect for the People That Like Me’
- Why McDonald’s Could Suddenly Be Responsible for Millions of New Employees
- Americans Want Medicare to Negotiate Better Deals on Drugs
Long Hours at Work Are Costing You More Than Your Social Life

Putting in long hours at the office might impress your boss, but they’re certainly not helping your health.
A new study published in The Lancet found that individuals who worked 55 hours per week or more had a 1-3 times greater risk of a stroke compared to those who worked 40 hours a week. Long working hours were also associated with an increased chance of coronary heart disease, but this association was found to be weaker than that for a stroke.
The analysis was the largest study conducted thus far of the affiliation between working hours and cardiovascular health, including data on more than 600,000 individuals in Europe, the U.S., and Australia.
Researchers believe the constant triggering of the stress response from overwork induces the stroke, often resulting in sudden death. In addition, behavioral activities that stem from the longer hours also contribute to the heightened chance of a stroke.
Employees who work longer hours are found to rely more on heavy alcohol consumption as a way to reduce stress, but drinking only increases the risk for all types of strokes. In addition, more time at a desk means long periods of physical inactivity, which can increase the risk of stroke.
A study by Credit Loan shows that employees worldwide are working more than 40 hours per week. The U.S. leads the pack with the highest percentages of overtime workers – 85.8 percent of males and 66.5 percent of females.
Someone ought to tell Jeb Bush before he repeats what he said early in the campaign -- that Americans need to put in more hours at work.
Why Millennials Are Waiting So Long to Buy Their First Homes

They may finally be moving out of their parents’ basements, but don’t expect those boomerang kids to be taking out a mortgage any time soon.
Today’s first-time homebuyer rents for an average of six years before buying his or her first home, according to a new analysis by Zillow. Time spent renting has been marching mostly upward since the 1970s, when first-time buyers rented for just 2.6 years before purchasing a home.
Today’s first-time buyers are also more likely to be single and older (with an average age of 32.5) than previous generations.
“Millennials are delaying all kinds of major life decisions, like getting married and having kids, so it makes sense that they would also delay buying a home,” Zillow Chief Economist Svenja Gudell said in a statement.
Related: Found Your Dream Home? 7 Tips for Getting the Best Deal
Part of the reason for that delay could be that homes cost much more than they did decades ago. Today’s homebuyer makes roughly the same amount of money in inflation-adjusted terms as a buyer in the 1970s, but the homes that they’re purchasing are about 60 percent more expensive.
There are other roadblocks for first-timers. Limited inventory and strong competition make the home buying process difficult for property virgins and student debt can make it tougher to get a mortgage.
Those six years spent renting aren’t coming cheap, either. In 2013, almost half of all renters were spending more than 30 percent of their income on housing, with more than a quarter sending half their income to their landlord every month, according to the “State of the Nation’s Housing 2015” report issued in June by the Harvard Joint Center for Housing Studies. That makes it pretty tough to save for a down payment.
Top Reads from the Fiscal Times:
- Trump as Commander in Chief? Tune in for a Foreign Policy Reality Show
- Clinton’s Email Fail May Be Innocent, but Americans Still Don’t Trust Her
- As Obamacare Costs Rise, the GOP Has a Real Chance to Reform Health Care
Remember the Ice Bucket Challenge? It Actually Did Some Good

It turns out all those videos of people dumping buckets of ice water on their heads that clogged your newsfeed last summer helped scientists make a major breakthrough in ALS research. (ALS stands for amyotrophic lateral sclerosis, a neurodegenerative disease also known as Lou Gehrig’s disease.)
A new study published in the journal Science last week details a new understanding of an important protein – TDP-43 – that is dysfunctional in more than 90 percent of ALS cases. The Johns Hopkins scientists behind the research thanked the Ice Bucket Challenge for helping them with the discovery by raising $115 million in donations for the ALS Association.
Related: The 9 Most Amazing ALS Ice Bucket Challenges
“We want to encourage all of you to continue this Ice Bucket Challenge to really push this work forward,” professor Philip Wong said in a YouTube video.
More than 17 million videos were uploaded to Facebook of people pouring cold water on themselves, including celebrities like Taylor Swift, Oprah, and Bill Gates. The money raised through the challenge helped the ALS Association triple the amount it typically spends on research for the disease each year.
The ALS Association has been encouraging people to once again participate in the challenge this August, having introduced the hashtag #EveryAugustUntilACure. And it’s working – every Major League Baseball team has pledged to take the Ice Bucket Challenge some time this month.
Top Reads From The Fiscal Times
- Why McDonald’s Could Suddenly Be Responsible for Millions of New Employees
- Mark Cuban: Here’s Why Republicans Will Lose the Election
- 6 Reasons Gas Prices Could Fall Below $2 a Gallon

