Automakers Are Having a Record Year, but Here’s a Trend that Should Worry Them

U.S. auto sales closed out the summer on a positive note, topping estimates and casting some rosy light on the health of the American consumer. Recording its best August since 2003, the auto industry is on pace to sell 17.8 vehicles in 2015, well ahead of expectations of 17.3 million. If the numbers hold up, 2015 will be the best year ever for U.S. auto sales, beating the 17.4 million mark set in 2000.
The general consensus is that auto industry is in pretty good shape these days. Gas prices and interest rates are low, boosting the market for cars and light trucks. More than 2 million jobs were added to the U.S. economy in the past year, and more jobs is usually good news for auto sales. The unemployment rate has been trending lower for five years, sitting at a relatively healthy 5.3 percent in July.
Related: What's Next for Oil Prices? Look Out Below!
As with any statistic, though, there’s more than one way to look at the situation. Sure, auto sales are climbing as the economy gets stronger and more Americans hit their local car dealers’ lots. At least to some degree, though, higher auto sales should be expected just as a result of U.S. population growth. And those rising monthly sales figures are masking a continuing trend that is more worrisome for the auto industry: per capita auto sales are still in a long-term decline, even including the solid growth the industry has seen since the end of the recession. Doug Short at Advisor Perspectives did the math and made a graph:

According to Short’s analysis, the peak year for per capita auto sales in the U.S. was 1978. As the red line in the graph shows, the trend is negative since then.
In the graph, per capita auto sales in January, 1976, were defined as 100; the readings in the index since then are relative to that 1976 sales level. As you can see, the index moves higher until August of 1978, when per capita auto sales were up nearly 20 percent over 1976. Since then, per capita auto sales have fallen, reaching a low in 2009 that was nearly 50 percent lower than 1976. Since 2009, per capita auto sales have risen nicely, but are still more than 15 percent below peak.
What could explain the negative trend? Two factors come to mind. First, demographics. It has been widely reported that the millennial generation is less interested in owning cars for a variety of reasons, ranging from a weak economy to a cultural shift away from suburban life. However, the data on millennial car purchases is ambiguous; recently, millennials have started buying cars in volumes that look a lot like their elders. And even if millennials are less interested in buying cars, their preferences can’t explain a shift that began in the 1970s, before they were born.
Related: U.S. Companies Are Dying Faster Than Ever
The other factor that may explain the trend is income inequality. A study of car ownership by the Carnegie Foundation found that countries with higher income inequality have fewer cars per capita. The logic is simple: As more income is claimed by the wealthy, there’s less to go around for everyone else. And that means there’s less money for middle and lower income groups to buy and maintain automobiles, among other things.
Here’s a chart of the Gini index for the U.S. since 1947. (The Gini Index is a widely-used measure of income inequality. A higher Gini number means higher inequality.) Note that the Gini reading started climbing in the late ‘70s – the same time when per capita car ownership in the U.S. began to fall.
This chart tells us, not for the first time, that the U.S. has experienced more income inequality since the 1970s. Combined with the per capita auto sales data above, it suggests that as the rich have gotten richer and everyone else has struggled to keep up, car ownership has suffered. Although this is by no means proof of the relationship between income inequality and per capita car ownership over the last 40 years, it hints at an interesting theory – and suggests that the auto industry has good reason to be concerned about growing inequality in the U.S.

Top Reads From The Fiscal Times:
- 6 Reasons Gas Prices Could Fall Below $2 a Gallon
- Hoping for a Raise? Here’s How Much Most People Are Getting
- What the U.S. Must Do to Avoid Another Financial Crisis
The Surprising Reason for the Boom in Snack Sales

Americans are increasingly dining alone, and they’re opting for snacks rather than full meals, according to a new report from NPD group.
A key driver of the trend is the growing number of single-person households, since solo eaters are more likely to opt for snack foods for dinner. Nearly a quarter of all snack foods consumed last year were consumed at mealtime.
“Smaller household sizes and eating alone are among the growing factors with snacking,” NPD food and beverage industry analyst Darren Seifer said in a statement. “Food manufacturers should think about the unique needs of the solo consumer when developing products and packaging, and marketing messages should be crafted to be relevant to them and their snacking behaviors.”
Related: The 12 Hottest Food Trends for 2015
A separate report released by Nielsen last year found that more than half of global diners had selected snacks in the past 30 days to replace a lunch, 48 percent had snacked for breakfast and 41 percent had snacked for dinner.
When making their selection, single diners prefer single-serve packages and are increasingly turning to “better-for-you” snacks, like fresh fruit, breakfast bars, and yogurt, NPD found.
Food manufacturers are starting to adapt to the demand for healthier options. In June, General Mills said it would stop using artificial colors and flavors by 2016, and Kellogg Co. has vowed to do so by 2018.
Even as demand grows for healthier snacks, the most popular snacks in North Americans might make a nutritionist cringe. Nielsen found that the most popular snacks were chips, followed by chocolate and cheese.
Top Reads from the Fiscal Times:
- The $1 Trillion Question for the F-35: Is the U.S. Buying an Inferior Plane?
- Hillary’s College Plan—Debt Free College Now, Tax Them When They Make Money
- You Won’t Believe What Some Job Seekers Are Putting on Their Resumes
Obamacare Drives Uninsured Rate to Record Low
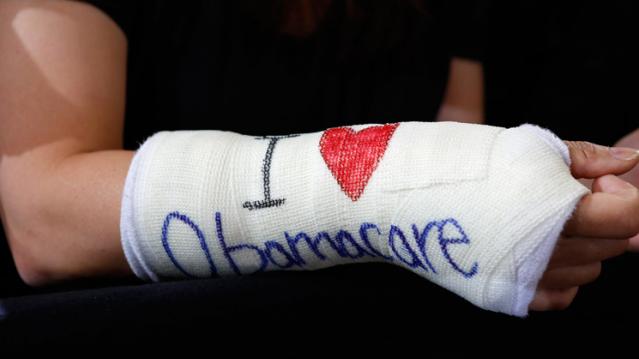
With the number of Americans lacking health insurance in decline, the rate of uninsured Americans has hit a record low, reaching levels not seen since the National Center for Disease Statistics began keeping records in 1972.
In the first quarter of 2015, 9.2 percent of all Americans were uninsured, according to new data from the Center for Disease Control and Prevention, down from 11.5 percent in 2014. The total number of uninsured Americans fell by 7 million over the past year, from 36 million in 2014 to 29 million in the first three months of 2015.
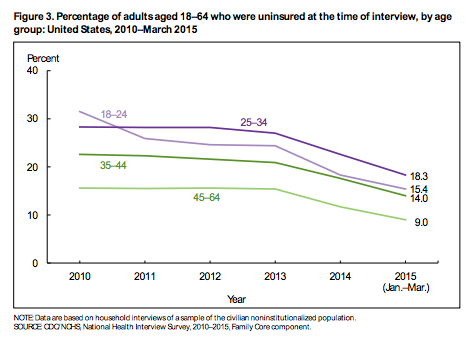
The largest declines were seen among adults who were poor or near-poor, suggesting that the Affordable Care Act was responsible for the most significant gains in coverage. Both groups dropped from uninsured rates near 50 percent in 2010 to 28 percent among poor adults and 23.8 percent among near-poor adults in 2015.
While Democrats are citing data as evidence that the Affordable Care Act is working, Republicans will likely argue that the reduction is being driven by an improving economy and a steadily declining unemployment rate.
Arkansas and Kentucky continue to record the most noticeable reductions in uninsured rates since Obamacare took effect at the beginning of 2013, according to a new report by Gallup. Texas is the only state to still have an uninsured rate higher than 20 percent.
We Built a $335 Million Power Plant in Afghanistan that Can Barely Turn on Lightbulb

USAID is denying that a $335 million “vital component” of their mission to aid the massive energy deficit in Kabul, Afghanistan is an utter failure, but a new report contradicts that claim.
A power plant built by U.S. Agency for International Development (USAID) is extremely underused and in danger of being wasted, according to the Special Inspector General for Afghanistan Reconstruction (SIGAR). USAID attempted to defend itself by saying the plant was only built to provide occasional backup and insurance for Kabul’s electrical grid, not for electrical power on a continuous basis. SIGAR’s report provides evidence that the plant was built for regular usage.
Related: U.S. Military Builds a $15 Million Warehouse That Nobody Wants
First, the basis of design was for a base load plant, built to operate 24 hours per day, 7 days a week. Also, the plant hasn’t made any impact on reducing Kabul’s massive energy deficit that USAID says is one of the plant’s main priorities. Not only is it not being used regularly, but it’s not even contributing additional electricity to increase the overall power supply in Kabul.
The Tarakhil Power Plant was built in July 2007 on the outskirts of Kabul, with the intention of supplying 18 diesel engines worth of operating power. Since Da Afghanistan Breshna Sherkat (DABS) – Afghanistan’s national power utility – assumed responsibility for the operation and maintenance of the facility in 2010, the plant has only performed at a shred of its total capability. Between July 2010 and December 2013, the USAID IG found that the plant performed at a mere 2.2 percent of its potential.
Since the Tarakhil Power Plant was used incorrectly and only on an intermittent basis, the plant has suffered premature wear and tear on its engine and electrical components. The damage is expected to raise already steep operation and maintenance costs.
Top Reads from the Fiscal Times:
- How ‘King Coal’ Could Swing the 2016 Election
- Kerry to Congress: Sign the Iran Deal or the Dollar Gets Hit
- China’s Currency Devaluation Brings Stocks to a 'Death Cross'
We Built a $335 Million Power Plant in Afghanistan that Can Barely Turn on Lightbulb
USAID is denying that a $335 million “vital component” of their mission to aid the massive energy deficit in Kabul, Afghanistan is an utter failure, but a new report contradicts that claim.
A power plant built by U.S. Agency for International Development (USAID) is extremely underused and in danger of being wasted, according to the Special Inspector General for Afghanistan Reconstruction (SIGAR). USAID attempted to defend itself by saying the plant was only built to provide occasional backup and insurance for Kabul’s electrical grid, not for electrical power on a continuous basis. SIGAR’s report provides evidence that the plant was built for regular usage.
Related: U.S. Military Builds a $15 Million Warehouse That Nobody Wants
First, the basis of design was for a base load plant, built to operate 24 hours per day, 7 days a week. Also, the plant hasn’t made any impact on reducing Kabul’s massive energy deficit that USAID says is one of the plant’s main priorities. Not only is it not being used regularly, but it’s not even contributing additional electricity to increase the overall power supply in Kabul.
The Tarakhil Power Plant was built in July 2007 on the outskirts of Kabul, with the intention of supplying 18 diesel engines worth of operating power. Since Da Afghanistan Breshna Sherkat (DABS) – Afghanistan’s national power utility – assumed responsibility for the operation and maintenance of the facility in 2010, the plant has only performed at a shred of its total capability. Between July 2010 and December 2013, the USAID IG found that the plant performed at a mere 2.2 percent of its potential.
Since the Tarakhil Power Plant was used incorrectly and only on an intermittent basis, the plant has suffered premature wear and tear on its engine and electrical components. The damage is expected to raise already steep operation and maintenance costs.
How Good Is Your Insurance? ‘Cadillac Tax’ Looms for Large Employer Health Plans

While most companies expect health care cost increases to hold steady next year, nearly half of large employers say that if they can’t find new ways to cut costs, they’re going to cross the “Cadillac tax” threshold in 2018, according to a new study by the National Business Group on Health.
Passed as part of the Affordable Care Act and going into effect in 2018, the Cadillac tax will hit employers whose plans cost more than $10,200 for an individual or $27,500 for a family. The employer will have to pay a 40 percent tax on the cost of each plan above those levels.
Among the companies surveyed, 48 percent said that at least one of their benefit plans would trigger the Cadillac Tax. By 2020, 72 percent of employers say one of their plans will trigger the tax, and 51 percent say their most popular plan will be subject to the tax.
Related: Obamacare’s Cadillac Tax Hits the College Campus
“The need to control rising health care benefits costs has never been greater,” NGBH President and CEO Brian Marcotte said in a statement. “Rising costs have plagued employers for many years and now the looming excise tax is adding pressure.”
Employers expect keep benefit costs increases to 5 percent this year by pushing more costs onto workers via consumer-directed health plans (76 percent) and expanding wellness initiatives (70 percent).
None of the 425 employers surveyed said they planned to eliminate their health care coverage, but nearly a quarter said they’d consider offering employees a private exchange.
Top Reads from the Fiscal Times:
- How ‘King Coal’ Could Swing the 2016 Election
- Kerry to Congress: Sign the Iran Deal or the Dollar Gets Hit
- China’s Currency Devaluation Brings Stocks to a 'Death Cross'