Automakers Are Having a Record Year, but Here’s a Trend that Should Worry Them

U.S. auto sales closed out the summer on a positive note, topping estimates and casting some rosy light on the health of the American consumer. Recording its best August since 2003, the auto industry is on pace to sell 17.8 vehicles in 2015, well ahead of expectations of 17.3 million. If the numbers hold up, 2015 will be the best year ever for U.S. auto sales, beating the 17.4 million mark set in 2000.
The general consensus is that auto industry is in pretty good shape these days. Gas prices and interest rates are low, boosting the market for cars and light trucks. More than 2 million jobs were added to the U.S. economy in the past year, and more jobs is usually good news for auto sales. The unemployment rate has been trending lower for five years, sitting at a relatively healthy 5.3 percent in July.
Related: What's Next for Oil Prices? Look Out Below!
As with any statistic, though, there’s more than one way to look at the situation. Sure, auto sales are climbing as the economy gets stronger and more Americans hit their local car dealers’ lots. At least to some degree, though, higher auto sales should be expected just as a result of U.S. population growth. And those rising monthly sales figures are masking a continuing trend that is more worrisome for the auto industry: per capita auto sales are still in a long-term decline, even including the solid growth the industry has seen since the end of the recession. Doug Short at Advisor Perspectives did the math and made a graph:

According to Short’s analysis, the peak year for per capita auto sales in the U.S. was 1978. As the red line in the graph shows, the trend is negative since then.
In the graph, per capita auto sales in January, 1976, were defined as 100; the readings in the index since then are relative to that 1976 sales level. As you can see, the index moves higher until August of 1978, when per capita auto sales were up nearly 20 percent over 1976. Since then, per capita auto sales have fallen, reaching a low in 2009 that was nearly 50 percent lower than 1976. Since 2009, per capita auto sales have risen nicely, but are still more than 15 percent below peak.
What could explain the negative trend? Two factors come to mind. First, demographics. It has been widely reported that the millennial generation is less interested in owning cars for a variety of reasons, ranging from a weak economy to a cultural shift away from suburban life. However, the data on millennial car purchases is ambiguous; recently, millennials have started buying cars in volumes that look a lot like their elders. And even if millennials are less interested in buying cars, their preferences can’t explain a shift that began in the 1970s, before they were born.
Related: U.S. Companies Are Dying Faster Than Ever
The other factor that may explain the trend is income inequality. A study of car ownership by the Carnegie Foundation found that countries with higher income inequality have fewer cars per capita. The logic is simple: As more income is claimed by the wealthy, there’s less to go around for everyone else. And that means there’s less money for middle and lower income groups to buy and maintain automobiles, among other things.
Here’s a chart of the Gini index for the U.S. since 1947. (The Gini Index is a widely-used measure of income inequality. A higher Gini number means higher inequality.) Note that the Gini reading started climbing in the late ‘70s – the same time when per capita car ownership in the U.S. began to fall.
This chart tells us, not for the first time, that the U.S. has experienced more income inequality since the 1970s. Combined with the per capita auto sales data above, it suggests that as the rich have gotten richer and everyone else has struggled to keep up, car ownership has suffered. Although this is by no means proof of the relationship between income inequality and per capita car ownership over the last 40 years, it hints at an interesting theory – and suggests that the auto industry has good reason to be concerned about growing inequality in the U.S.

Top Reads From The Fiscal Times:
- 6 Reasons Gas Prices Could Fall Below $2 a Gallon
- Hoping for a Raise? Here’s How Much Most People Are Getting
- What the U.S. Must Do to Avoid Another Financial Crisis
It’s Not Just in Your Head, the Web Is Slowing Down

It’s not your imagination, and it’s not because AT&T — and possibly others — is purposefully cutting speeds to unlimited data plan users. The Internet is slowing down. The reason: Websites are growing in size, causing slower load times.
The average website is now 2.1 MB in size, compared to 1.5 MB two years ago, according to HTTP Archive, an Internet data measurement company. Multiple reasons can explain this increase in size.
Sites have been adding more content in an effort to drum up traffic, such as videos, engaging images, interactive plug-ins (comments and feeds) and other code and script-heavy features. Websites are becoming more and more technically advanced, and other sites have to keep adding features to stay competitive.
To keep up with the rapidly increasing number of users accessing sites on various platforms, developers are offering more versions of websites as well as apps to accommodate all devices, including smartphones, watches, tablets, and other gadgets. All of these versions require additional code, ultimately adding to the weight of a given website.
Then there are the advertisers who want to get the user’s attention by creating dramatic displays for their products that consume even more bandwidth.
Websites also want to know who is visiting their pages, both welcome and unwelcome visitors. New tools that track and analyze visitors have increased in popularity, as well as stronger encryption technology to add more security. These security measures and trackers require more code, again slowing load times.

Unfortunately for websites trying to keep up with the times, Google has just introduced a new ‘Slow to Load’ warning sign in mobile search results. Since mobile searches account for more than half of the total Google searches in 10 countries, Google wants to enhance user experience for those on their mobile platform.
Although the weight of a website isn’t all that contributes to slow loading, it’s a major factor. Other reasons include users overusing data, a poor connection, or a high level of traffic in the mobile network.
Google also changed its algorithm in April, so now ‘mobile friendly’ sites are ranked higher on search results, while those that fail to meet its criteria are ranked lower.
Although the internet is only slowing by a matter of seconds, it’s still slowing down. All the more reason for a user to become frustrated with a page that’s taking a couple extra seconds to load and go to a competitor’s site.
Taylor Swift Gets Apple Music to Pay Up

On Sunday morning, Taylor Swift took Apple to task for the royalty agreement on its news music streaming service. Her open letter on Tumblr, titled “To Apple, Love Taylor,” said, “I’m sure you are aware that Apple Music will be offering a free 3 month trial to anyone who signs up for the service. I’m not sure you know that Apple Music will not be paying writers, producers, or artists for those three months. I find it to be shocking, disappointing and completely unlike this historically progressive and generous company.”
Related Link: How the Video Game Industry Is Failing Its Fans
“Three months is a long time to go unpaid, and it is unfair to ask anyone to work for nothing,” the pop singer argued on the behalf of music-makers everywhere, many of whom had voiced their discontent with the royalty policy. She concluded her letter saying, “We don’t ask you for free iPhones. Please don’t ask us to provide you with our music for no compensation.”
It was a sentiment shared by many independent music artists and producers. Just a few weeks earlier, the American Association for Independent Music had chimed in, “Since a sizable percentage of Apple’s most voracious music consumers are likely to initiate their free trials at launch, we are struggling to understand why rights holders would authorize their content on the service before October 1st.”
It took less than 24 hours for the “historically progressive and generous company” to respond via Twitter, and it didn’t wait until morning to make its announcement. Eddy Cue, Apple’s senior vice president of Internet Software and Services, personally called Swift to deliver the news before tweeting at 11:29 p.m., “#AppleMusic will pay artists for streaming, even during customers’ free trial period.”
Cue followed up with a feel-good response a minute later: “We hear you @taylorswift13 and indie artists. Love, Apple.” Later, Cue said that the company will pay artists on a per stream basis during the free trial period, although Cue declined to say what the rate would be. Once the free introductory period is over, Apple Music will pay music owners 71.5 percent of Apple Music’s overall subscription revenue in the United States.
Swift tweeted her response and addressed it to her fans and supporters: “I am elated and relieved. Thank you for your words of support today. They listened to us.”
Related Link: Apple Muscles Into Streaming Music Market
Swift’s crusade on social media showed the increasing weight that collective opinions on Twitter, Instagram and Facebook can have to force a change in corporate policy and direction. In a comic echo of that power, BuzzFeed promptly put together a list of 18 more issues Swift could fix through the power of social media, ranging from the battery life of iPhones to the size of Pringles cans.
Apple Music is launching on June 30, offering users a free, three-month subscription period. After that, the service will charge $9.99 a month for individuals and $14.99 a month for families with up to six members.
Most Americans Wouldn’t Vote for a Socialist President

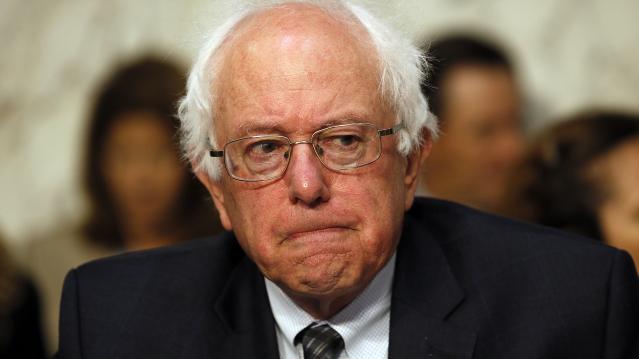
Memo to Sen. Bernie Sanders:
Americans by overwhelming numbers say they would vote for a qualified presidential candidate nominated by their party who is Catholic, a woman, black, Hispanic or Jewish.
They say they would be somewhat less inclined to support a Mormon, a gay or lesbian, an evangelical Christian or Muslim for president, according to a new Gallup Poll released Monday. Yet more than half of those Americans surveyed said they would be accepting of anyone from this group who managed to garner their party’s presidential nomination. Even a qualified atheist would be acceptable to 58 percent of those questioned.
But only 47 percent said they could vote for a socialist for president. Fifty percent said they would absolutely not.
Related: Where Hillary Clinton, Bernie Sanders and Martin O’Malley Stand on the Issues
Sanders, 73, an independent who is challenging Hillary Clinton for the Democratic nomination, is the only Jewish candidate in the race. And while many wrote him off early on as a fringe candidate with limited appeal, Sanders has subsequently generated considerable buzz among liberals and progressives, and has made respectable showings in some of the early polling, including in New Hampshire.
With his ringing anti-Wall Street populist message, Sanders is tapping into the Democratic Party’s progressive wing – including some who had hoped at one time that Sen. Elizabeth Warren (D-MA) might change her mind and enter the race. However, the former University of Chicago student radical and self-described democratic socialist, supports proposals similar to those of mainstream social democratic governments in Europe, particularly those of Scandinavia.
Five of the declared candidates for president are Catholics – including Republicans Jeb Bush, George Pataki, Marco Rubio and Rick Santorum, and Democrat Martin O'Malley. Two are women -- Clinton and Republican Carly Fiorina. Republican Ben Carson is the only black candidate in the race, while two candidates are Hispanic -- Republicans Rubio and Ted Cruz.
Here are Gallup’s findings:

The Hidden Costs of Home Ownership: $6,000 a Year

Most new homeowners are prepared to pay their mortgages, but they may not be ready for other unavoidable costs that can amount to thousands of dollars every year.
The average homeowner shelled out $6,042 last year in homeowners insurance, property taxes, and utilities, according to a new report from Zillow. The average costs varied by location, with Boston homeowners spending the most ($9,413) and homeowners in Phoenix spending the least ($4,513).
“Home buyers too often fixate on the sticker price or monthly mortgage payment on a house, and don’t budget for the other expenses associated with ownership -- which can add up quickly,” Zillow spokeswoman Amy Bohutinsky said in a statement.
Related: How to Decide if You Should Rent or Buy a Home
The maintenance costs included in the report included things like lawn care and carpet cleaning.
The country’s homeownership rate fell to 63.7 percent in the first quarter, the lowest level since 1989. The rate peaked at 69.2 percent in the fourth quarter of 2004, right before the housing bubble burst.
As rents in many cities continue to skyrocket, however, homeownership may be becoming more appealing. However, in addition to hidden homeownership costs, new buyers should also consider the opportunity costs of potential earnings if buyers had invested their down payment. The New York Times has a handy calculator that incorporates these and other factors to help weigh whether it makes more sense to rent or buy.
Nearly two-thirds of consumers say that home ownership is a “dream come true” and an accomplishment to be proud of, according to a survey released last week by Wells Fargo.
Here’s How Much Boomers Are Giving Their Kids
Money has always tended to flow from parents or grandparents to children and grandchildren, whether it’s as outright gifts, help with living expenses or paying for things like school. But the pace of that inter-generational transfer of wealth has picked up in recent years — and it could be threatening the retirement prospects of some baby boomers, according to a new report from the Employee Benefit Research Institute.
The report finds that the number of cash transfers going from older households to younger family members increased from 1998 to 2010. High-income households are more likely to provide support to their adult children, but middle- and low-income families are also providing cash to younger family members. Overall, from 2008 to 2010, households of adults aged 50 to 64 gave an average of $8,350 to younger family members, and households age 85 and older gave $4,787 to younger family members.
“For older households, cash transfers can reduce their retirement assets, raising concerns about retirement security, particularly for low-income groups,” EBRI research associate Sudipto Banerjee said in a statement.
Related: Sandwich Generation Squeezed Once Again
In just 5 percent of families, wealth is passed from the younger generation to the older, and the amounts are far smaller. During the same period, households age 85 and older received an average of $359 from those in younger generations.
The EBRI numbers confirm a trend highlighted in other recent reports. A 2013 Pew study found that about half of adults ages 40 to 59 have provided some financial support to at least one grown child in the past year, with more than a quarter of them providing the primary support.
Obviously, the economic climate of recent years may be a big reason for the increased cash flowing from parents to their grown children. More than half of parents of millennials think that it is harder for today’s young adults to live within their means than it was for them, according to an April Bank of America survey.
