Automakers Are Having a Record Year, but Here’s a Trend that Should Worry Them

U.S. auto sales closed out the summer on a positive note, topping estimates and casting some rosy light on the health of the American consumer. Recording its best August since 2003, the auto industry is on pace to sell 17.8 vehicles in 2015, well ahead of expectations of 17.3 million. If the numbers hold up, 2015 will be the best year ever for U.S. auto sales, beating the 17.4 million mark set in 2000.
The general consensus is that auto industry is in pretty good shape these days. Gas prices and interest rates are low, boosting the market for cars and light trucks. More than 2 million jobs were added to the U.S. economy in the past year, and more jobs is usually good news for auto sales. The unemployment rate has been trending lower for five years, sitting at a relatively healthy 5.3 percent in July.
Related: What's Next for Oil Prices? Look Out Below!
As with any statistic, though, there’s more than one way to look at the situation. Sure, auto sales are climbing as the economy gets stronger and more Americans hit their local car dealers’ lots. At least to some degree, though, higher auto sales should be expected just as a result of U.S. population growth. And those rising monthly sales figures are masking a continuing trend that is more worrisome for the auto industry: per capita auto sales are still in a long-term decline, even including the solid growth the industry has seen since the end of the recession. Doug Short at Advisor Perspectives did the math and made a graph:

According to Short’s analysis, the peak year for per capita auto sales in the U.S. was 1978. As the red line in the graph shows, the trend is negative since then.
In the graph, per capita auto sales in January, 1976, were defined as 100; the readings in the index since then are relative to that 1976 sales level. As you can see, the index moves higher until August of 1978, when per capita auto sales were up nearly 20 percent over 1976. Since then, per capita auto sales have fallen, reaching a low in 2009 that was nearly 50 percent lower than 1976. Since 2009, per capita auto sales have risen nicely, but are still more than 15 percent below peak.
What could explain the negative trend? Two factors come to mind. First, demographics. It has been widely reported that the millennial generation is less interested in owning cars for a variety of reasons, ranging from a weak economy to a cultural shift away from suburban life. However, the data on millennial car purchases is ambiguous; recently, millennials have started buying cars in volumes that look a lot like their elders. And even if millennials are less interested in buying cars, their preferences can’t explain a shift that began in the 1970s, before they were born.
Related: U.S. Companies Are Dying Faster Than Ever
The other factor that may explain the trend is income inequality. A study of car ownership by the Carnegie Foundation found that countries with higher income inequality have fewer cars per capita. The logic is simple: As more income is claimed by the wealthy, there’s less to go around for everyone else. And that means there’s less money for middle and lower income groups to buy and maintain automobiles, among other things.
Here’s a chart of the Gini index for the U.S. since 1947. (The Gini Index is a widely-used measure of income inequality. A higher Gini number means higher inequality.) Note that the Gini reading started climbing in the late ‘70s – the same time when per capita car ownership in the U.S. began to fall.
This chart tells us, not for the first time, that the U.S. has experienced more income inequality since the 1970s. Combined with the per capita auto sales data above, it suggests that as the rich have gotten richer and everyone else has struggled to keep up, car ownership has suffered. Although this is by no means proof of the relationship between income inequality and per capita car ownership over the last 40 years, it hints at an interesting theory – and suggests that the auto industry has good reason to be concerned about growing inequality in the U.S.

Top Reads From The Fiscal Times:
- 6 Reasons Gas Prices Could Fall Below $2 a Gallon
- Hoping for a Raise? Here’s How Much Most People Are Getting
- What the U.S. Must Do to Avoid Another Financial Crisis
3 Big Reasons You’re Getting Nothing Done at Work

Cell phones often get blamed for the always-on work culture that keeps us tethered to our jobs around the clock.
Turns out they might be the reason we’re not getting our work done during office hours in the first place. More than half of employers say that cell phones and texting are the biggest productivity killers at work, making them the number one distraction, according to a new survey from CareerBuilder.com.
Other top productivity killers included the Internet, named by 44 percent of employers, gossip (37 percent), and social media (37 percent).
Related: 10 Ways to Boost Happiness at Work
“There are so many stimulants in today’s workplace, it’s easy to see how employees get sidetracked,” Rosemary Haefner, Career Builder’s Chief Human Resources Officer said in a statement “The good news is, taking breaks from work throughout the day can actually be good for productivity, enabling the mind to take a break from the job at hand and re-energize you.”
Nearly half of employers said that such distractions compromised the quality of work, and 30 percent said they caused lower morale since other workers had to pick up slack for their preoccupied peers. A quarter of employers said that distractions hurt the boss/employee relationship.
Nearly 3 in 4 employers have been proactive about battling productivity killers, with a third blocking certain Internet sites and 23 percent banning personal cell phone calls and usage on the job.
Haefner recommends that workers stay focused by scheduling breaks, surrounding themselves with productive people and taking walks to rejuvenate the brain.
Now 16-Year-Olds Can Double Your Car Insurance
As if you don’t have enough to worry about when your 16-year-old hits the road for the first time, get ready to see your insurance bill nearly double.
The average insurance premium for a married couple goes up 80 percent on average when adding a teen, but it spikes a full 16 percent more for adding a 16-year-old, according to a new report by InsuranceQuotes.com.
Requesting a “good student” discount is one way to offset the premium hike. “I’ve seen discounts as high as 25 percent for students who maintain at least a B average in high school or college,” InsuranceQuotes.com senior analyst Laura Adams said in a statement.
Related: The Best Time to Buy Car Insurance
And once a teen hits the ripe old age of 19, insurance increases by just 60 percent.
It’s much more expensive to insure teenage boys, with premiums increasing 92 percent for teen males versus just 67 percent for girls.
The analysis found that teenagers cost the most to insure in New Hampshire (115 percent increase), but parents will also see premiums double in Wyoming, Illinois, Maine and Rhode Island.
Hawaii is the only state that prohibits insurance companies from basing insurance quotes on age or length of driving experience, so it has the lowest increase in the nation (17 percent). Other states where parents won’t take as big a hit are New York (53 percent) and Michigan (57 percent).
Parents may be able to nab better car insurance rates by shopping around with several insurers.
Thinking Ahead Could Be Holding Women Back

Different attitudes in how men and women prepare for their futures might be a factor contributing to the gender gap, a new study published in Gender & Society finds.
In imagining their work paths, women were disproportionately more likely to think and worry about parenthood than men. And in anticipation of the responsibilities and challenges that parenthood brings, women were more likely than men to downscale or alter their career goals.
Brooke Conroy Bass, who wrote the article, conducted in-depth interviews with 30 heterosexual couples between 25 and 34 who have not (yet) had children.
Related: Millennial Women Are Taking Charge – at Home and at Work
Preparing for the future has emotional and behavioral consequences for women that men don’t suffer as much from, she found. Because of these “gendered anticipations of parenthood,” the inequality in the market starts much earlier than we tend to think.
Bass told Futurity that career trajectories among men and women shift as parenthood approaches, with men investing more effort in their jobs and women dialing back.
The study suggests that part of the problem contributing to the gender wage gap, penalization for maternity leave and the difficulty of making it to the top is anticipating the future.
But should women be penalized for displaying foresight, a characteristic that employers usually value?
American Kids Aren’t Such Stoners After All

Turns out the young people of America are not as high as you thought they were. The use of illicit drugs, alcohol and tobacco among young people has been falling, according to new data.
While the nationwide rate of illicit drug use has gone up, the percentage of youths using illicit drugs has declined, according to a report from the Substance Abuse and Mental Health Service Administration (SAMSHA), part of the Department of Health and Human Services. The illicit drugs include marijuana/hashish, cocaine (including crack), hallucinogens, heroin, inhalants or prescription-type psychotherapeutics.
Among youths aged 12 to 17, the rate of illicit drug use was down to 8.8 percent in 2013 from 9.5 to 11.6 percent in the years 2002 to 2007, the SAMSHA study said.
Related: New Lifetime Estimate of Obesity Costs: $92,235 Per Person
But in 2013, drug use among those 12 or older was up to 9.4 percent from the 7.9 to 8.7 percent found between 2002 and 2009. The rise was attributed to increased rates of marijuana use, both medical and nonmedical, among adults aged 26 and older — and that rise probably doesn't fully reflect the recent legalization of recreational marijuana in Colorado, Washington, Oregon and Alaska.
The report also suggested that alcohol is losing some of its allure for the young.
Between 2002 and 2013, the percentage of underage people who drank declined from 28.8 percent to 22.7 percent. In addition, the proportion of binge drinkers — those who consumed five or more drinks during one occasion — decreased from 19.3 percent to 14.2 percent in the same years.
In additional good news, tobacco and cigarette use among all age groups has declined sharply since 2002.
Your Airplane Carry-on Bag Is About to Shrink
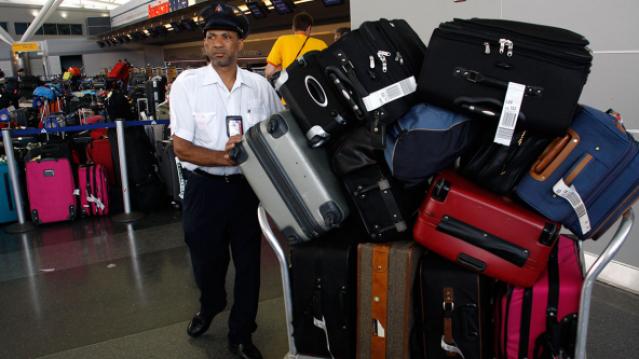
Are you one of those people who likes to brag about how you can fit a week’s worth of stuff into your carry-on suitcase? If so, your job is about to get harder.
The International Air Transport Association, a trade group representing some 250 airlines, has introduced a proposal to reduce the maximum allowable carry-on suitcase size. Under the proposed rule change, carry-on bags would have to be less than 21.5 x 13.5 x 7.5 inches. Current rules for carry-on size vary by airline, but they’re generally larger than that.
The organization claims that this would allow all passengers on a plane to store their bags in the cabin. “The development of an agreed optimal cabin bag size will bring common sense and order to the problem of differing sizes for carry-on bags,” IATA Senior Vice President for Airport, Passenger and Cargo Security said in a statement. “We know the current situation can be frustrating for passengers.
Related: 6 Sneaky Fees That Are Making Airlines a Bundle
Several major airlines have signaled interest in introducing the guidelines, according to IATA. Luggage manufacturers will start labeling bags that meet the new criteria as “IATA Cabin OK.”
The rule change may force more consumers to check luggage and pay the checked-bag fees many airlines have introduced in the past few years. Airlines typically charge $25 for the first bag, $35 for the second, and more than $100 for a third bag.
Some airlines, including Spirit, Allegiant and Frontier, also charge passengers for carry-on bags.