Automakers Are Having a Record Year, but Here’s a Trend that Should Worry Them

U.S. auto sales closed out the summer on a positive note, topping estimates and casting some rosy light on the health of the American consumer. Recording its best August since 2003, the auto industry is on pace to sell 17.8 vehicles in 2015, well ahead of expectations of 17.3 million. If the numbers hold up, 2015 will be the best year ever for U.S. auto sales, beating the 17.4 million mark set in 2000.
The general consensus is that auto industry is in pretty good shape these days. Gas prices and interest rates are low, boosting the market for cars and light trucks. More than 2 million jobs were added to the U.S. economy in the past year, and more jobs is usually good news for auto sales. The unemployment rate has been trending lower for five years, sitting at a relatively healthy 5.3 percent in July.
Related: What's Next for Oil Prices? Look Out Below!
As with any statistic, though, there’s more than one way to look at the situation. Sure, auto sales are climbing as the economy gets stronger and more Americans hit their local car dealers’ lots. At least to some degree, though, higher auto sales should be expected just as a result of U.S. population growth. And those rising monthly sales figures are masking a continuing trend that is more worrisome for the auto industry: per capita auto sales are still in a long-term decline, even including the solid growth the industry has seen since the end of the recession. Doug Short at Advisor Perspectives did the math and made a graph:

According to Short’s analysis, the peak year for per capita auto sales in the U.S. was 1978. As the red line in the graph shows, the trend is negative since then.
In the graph, per capita auto sales in January, 1976, were defined as 100; the readings in the index since then are relative to that 1976 sales level. As you can see, the index moves higher until August of 1978, when per capita auto sales were up nearly 20 percent over 1976. Since then, per capita auto sales have fallen, reaching a low in 2009 that was nearly 50 percent lower than 1976. Since 2009, per capita auto sales have risen nicely, but are still more than 15 percent below peak.
What could explain the negative trend? Two factors come to mind. First, demographics. It has been widely reported that the millennial generation is less interested in owning cars for a variety of reasons, ranging from a weak economy to a cultural shift away from suburban life. However, the data on millennial car purchases is ambiguous; recently, millennials have started buying cars in volumes that look a lot like their elders. And even if millennials are less interested in buying cars, their preferences can’t explain a shift that began in the 1970s, before they were born.
Related: U.S. Companies Are Dying Faster Than Ever
The other factor that may explain the trend is income inequality. A study of car ownership by the Carnegie Foundation found that countries with higher income inequality have fewer cars per capita. The logic is simple: As more income is claimed by the wealthy, there’s less to go around for everyone else. And that means there’s less money for middle and lower income groups to buy and maintain automobiles, among other things.
Here’s a chart of the Gini index for the U.S. since 1947. (The Gini Index is a widely-used measure of income inequality. A higher Gini number means higher inequality.) Note that the Gini reading started climbing in the late ‘70s – the same time when per capita car ownership in the U.S. began to fall.
This chart tells us, not for the first time, that the U.S. has experienced more income inequality since the 1970s. Combined with the per capita auto sales data above, it suggests that as the rich have gotten richer and everyone else has struggled to keep up, car ownership has suffered. Although this is by no means proof of the relationship between income inequality and per capita car ownership over the last 40 years, it hints at an interesting theory – and suggests that the auto industry has good reason to be concerned about growing inequality in the U.S.

Top Reads From The Fiscal Times:
- 6 Reasons Gas Prices Could Fall Below $2 a Gallon
- Hoping for a Raise? Here’s How Much Most People Are Getting
- What the U.S. Must Do to Avoid Another Financial Crisis
Undertrained US Drone Pilots Put War Effort at Risk

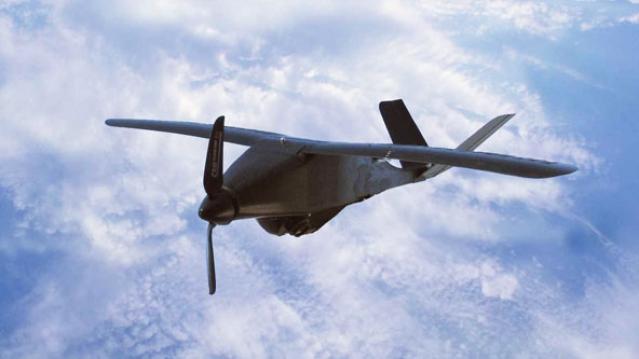
The U.S. military is allowing pilots who haven’t fully completed their training to fly predator drones over Yemen and Pakistan—potentially putting innocent people on the ground at risk if something goes wrong.
An alarming new report by the Government Accountability Office found that drone pilots in the Army and Air Force have been skimping on their training sessions in order to get assigned to missions faster.
Related: Who Knew the Navy Could Launch 30 Drones in 60 Seconds?
The GAO said that because there is a shortage of drone pilots, the Air Force and Army have been routinely speeding up the process by cutting training time.
“As a result, the Army does not know the full extent to which pilots have been trained and are therefore ready to be deployed,” the report said.
The GAO reviewed Air Force records and found that only 35 percent of pilots operating drones had completed their required training.
Some pilots told the auditors that training wasn’t completed because there was a lack of funding or gaps in knowledge about the unmanned aerial systems (UAS) commonly called drones.
“Army UAS pilots stated that leadership of larger non-aviation units that oversee their UAS units do not understand UAS pilot training,” the report said.
The GAO had previously reported that there weren’t enough drone pilots compared with the number the Air Force said it needed. At New Mexico’s Holloman Air Force Base, for example, drone pilot staffing was at only 63 percent of full staffing level, the report said.
The latest findings from the GAO seem to confirm that this is still an issue.
Related: The Duck Drone That Could Change the Navy
The U.S. military says it is taking action to increase the number of instructors in order to get more pilots through the complete training process. However, the GAO said that the Army hasn’t fully addressed “the risks associated with using less experienced instructors.”
The Army waived course prerequisites for nearly 40 percent of its drone pilots who were working toward becoming instructors.
“As a result, the Army risks that its UAS pilots may not be receiving the highest caliber of training needed to prepare them to successfully perform UAS missions,” the auditors said.
Meanwhile the Air Force faces instructor shortages as well.
The report calls into question whether a lack of training could hamper drone pilots’ ability to successfully and safely complete their missions. It comes amid intense scrutiny of the government’s drone program after a botched mission in January killed two Western hostages during an attack on al Qaeda in Pakistan.
Scrutiny of the program is nothing new. Human rights activists have long called on the administration to cease using drones in its ongoing war on terror because of civilian casualties.
A 2013 report by Human Rights Watch said that between 2009 and 2013, U.S. drone strikes killed 57 civilians in six different strikes in Yemen. Last year the Yemeni government paid $1 million to families of victims of one of those strikes, which targeted a wedding and killed 11 people.
You Won’t Believe How Much It Costs When Your Dog Bites Someone

Boy, it can really smart when your dog bites somebody.
Insurance companies paid an average of $32,000 last year in homeowner’s liability claims for dog-related injuries, according to a new analysis by the Insurance Information Institute (III).
But don’t think that’s your insurer’s problem. Filling one liability claim can take a bite out of your savings if you don’t have the right policy and push up your homeowner’s insurance premiums by an average of 14 percent, according to a recent analysis by InsuranceQuotes.com.
Dog bites and other dog-related injuries totaled $530 million and accounted for more than a third of all homeowners’ insurance liability dollars paid out in 2014. In addition to dog bites, the claims cover the costs of dogs knocking down children or bikers, resulting in fractures or trauma.
The number of claims last year fell by about 5 percent, but the cost per claim spiked 15 percent. The cost of dog-related injury claims has gone up 57 percent in the past decade, thanks to increasing medical costs and growing judge and jury awards.
Related: The Real Cost of Filing a Homeowners’ Insurance Claim
California had the most claims in the country, with 1,866, while New York had the highest average cost per claim -- an average of nearly $57,000 last year.
A separate report released Thursday by the U.S Postal Service showed that there were 74 dog attacks on postal workers in Los Angeles last year, the most of any city, followed by 62 in Houston, and 47 in San Diego.
III recommends that dog lovers research the safest and most appropriate dog for their household or neighborhood before purchasing a pup and use caution when bringing a dog into a home with an infant or toddler.
Or try a parakeet.
Where the Gold Is: 40 Nations with Highest Holdings

The World Gold Council is out with its latest report on gold demand.
In the first quarter, demand dropped by 11 tonnes, or 1%, year-over-year.
"Top-line demand was broadly neutral — down just 11t (1%) despite substantial underlying differences across geographies and sectors," the report said.
Related: Putin Is Hoarding Gold and Rattling Sabers--What’s He Up to Now?
"Pockets of strength in jewelry were balanced by weakness elsewhere as demand responded to local conditions in each market. Higher volumes in India, the US, and the smaller Southeast Asian markets were set against declines in China, Turkey, Russia, and the Middle East."
On Thursday, gold continued its rally after breaking above the key $1,200 level on Wednesday.
Gold rose to as high as $1,223 an ounce, its highest level in three months.
And so with gold demand broadly neutral, this chart shows which countries are holding the most gold:

This article originally appeared on Business Insider.
Read more from Business Insider:
Here is the most popular baby name in every state
More than 80% of Americans say they couldn't afford college
The Saudi's just went nuclear on their Obama snub
We Just Went Through the Worst Month Since the Great Recession

We already knew the economy really struggled over the first few months of 2015, with March being especially rough. A new report from economists at Macroeconomic Advisers shows just how bad a month it really was.
The forecasting firm, which tracks economic progress on a monthly basis rather than just a quarterly one, now says that GDP fell 1 percent in March. “This was the largest decline since December 2008, when the U.S. economy was in the throes of recession,” its update notes.
The Commerce Department initially estimated that GDP grew at a seasonally adjusted annual rate of 0.2 percent in the first quarter. An updated report, due May 29, is now expected to show that the economy actually shrank over the first three months of the year. J.P. Morgan economists have lowered their tracking estimate of first-quarter GDP from -0.8 percent to -1.1 percent based on data released over the last two days.
Related: Why So Many Americans Are Trapped in ‘Deep Poverty’
As we’ve written before, though, the downturn isn’t necessarily reason to worry about the fundamental health of the economy, or at least it shouldn’t stoke fears that we’re diving into another recession. As the Macroeconomic Advisers report explains, “A sharp decline in net exports more than accounted for the decline in monthly GDP, as resolution to the West Coast port dispute led to a surge in imports to well above the recent trend. As a result, they write, they believe the one-month plunge “overstates the underlying weakness in the economy.”
That’s not to say the economy is particularly strong, either. Both Macroeconomic Advisers and J.P. Morgan now forecast second-quarter GDP growth to come in at a tepid 2 percent annualized rate.
How Safe Is that Flight? Auditors Question Airport Security

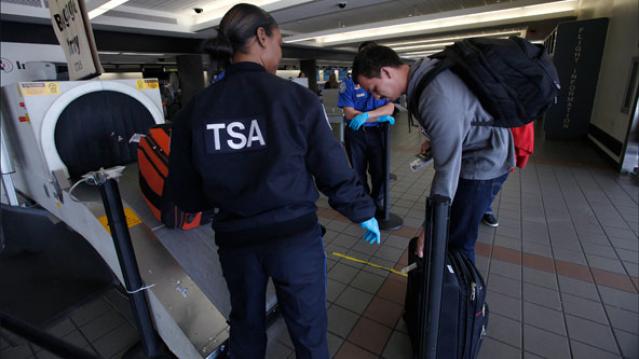
A government spat between Congress and the Transportation Safety Administration yesterday raised a question: Is the TSA trying to stonewall a congressional committee looking into reports suggesting the agency may be failing in its $7 billion-a-year mission to safeguard airports and air travel from terrorist threats?
At the start of Wednesday’s TSA: Are Airports Safe? hearing, House Oversight Committee Chairman Jason Chaffetz (R-UT ) immediately pointed out a glaring absence from the witness panel—the TSA.
Related: Poor Maintenance Could Make that Airport Scanner a Dud
Chaffetz said the committee had invited TSA acting administrator Melvin Carraway, but the agency offered a lower-level official in his place.
“The Department of Homeland Security objected to [Carraway’s] presence on the panel because they felt it was demeaning to have the acting director sit on the same panel as a private sector witness,” he said, referring to Raffi Fron, president of New Age Security Solutions, a company that provides security systems such as video surveillance.
The hearing was prompted by two separate but equally scathing watchdog reports that question the TSA’s ability to effectively screen passengers.
“Our audits have repeatedly found that human error— often a simple failure to follow protocol—poses significant vulnerabilities,” DHS’s IG John Roth said—adding that despite offering hundreds of recommendations the TSA has failed to assure that its mission is succeeding.
Related: Report Says TSA Wasted $1 Billion on Screening Program
DHS stood by its decision not to send its acting administrator. An agency official told The Fiscal Times that the department only participates in congressional hearing panels with other government agencies—not with private-sector witnesses in order to avoid conflicts of interest.
A spokesperson for the committee said that “witness invitations are not transferable” and that the “DHS does not dictate how we run our hearings.”
This isn’t the only roadblock the Oversight Committee has run into with the TSA. During the hearing, Chairman Chaffetz showed off a heavily redacted document he had requested from the agency—saying even members of Congress had “exceptional” difficulties getting information from them.
The committee spokesperson said House Oversight is currently looking into other ways the TSA has frustrated congressional inquiries—and what kinds of action can be taken.
