Automakers Are Having a Record Year, but Here’s a Trend that Should Worry Them

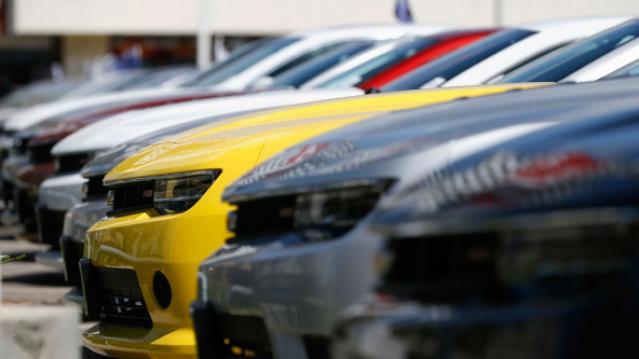
U.S. auto sales closed out the summer on a positive note, topping estimates and casting some rosy light on the health of the American consumer. Recording its best August since 2003, the auto industry is on pace to sell 17.8 vehicles in 2015, well ahead of expectations of 17.3 million. If the numbers hold up, 2015 will be the best year ever for U.S. auto sales, beating the 17.4 million mark set in 2000.
The general consensus is that auto industry is in pretty good shape these days. Gas prices and interest rates are low, boosting the market for cars and light trucks. More than 2 million jobs were added to the U.S. economy in the past year, and more jobs is usually good news for auto sales. The unemployment rate has been trending lower for five years, sitting at a relatively healthy 5.3 percent in July.
Related: What's Next for Oil Prices? Look Out Below!
As with any statistic, though, there’s more than one way to look at the situation. Sure, auto sales are climbing as the economy gets stronger and more Americans hit their local car dealers’ lots. At least to some degree, though, higher auto sales should be expected just as a result of U.S. population growth. And those rising monthly sales figures are masking a continuing trend that is more worrisome for the auto industry: per capita auto sales are still in a long-term decline, even including the solid growth the industry has seen since the end of the recession. Doug Short at Advisor Perspectives did the math and made a graph:

According to Short’s analysis, the peak year for per capita auto sales in the U.S. was 1978. As the red line in the graph shows, the trend is negative since then.
In the graph, per capita auto sales in January, 1976, were defined as 100; the readings in the index since then are relative to that 1976 sales level. As you can see, the index moves higher until August of 1978, when per capita auto sales were up nearly 20 percent over 1976. Since then, per capita auto sales have fallen, reaching a low in 2009 that was nearly 50 percent lower than 1976. Since 2009, per capita auto sales have risen nicely, but are still more than 15 percent below peak.
What could explain the negative trend? Two factors come to mind. First, demographics. It has been widely reported that the millennial generation is less interested in owning cars for a variety of reasons, ranging from a weak economy to a cultural shift away from suburban life. However, the data on millennial car purchases is ambiguous; recently, millennials have started buying cars in volumes that look a lot like their elders. And even if millennials are less interested in buying cars, their preferences can’t explain a shift that began in the 1970s, before they were born.
Related: U.S. Companies Are Dying Faster Than Ever
The other factor that may explain the trend is income inequality. A study of car ownership by the Carnegie Foundation found that countries with higher income inequality have fewer cars per capita. The logic is simple: As more income is claimed by the wealthy, there’s less to go around for everyone else. And that means there’s less money for middle and lower income groups to buy and maintain automobiles, among other things.
Here’s a chart of the Gini index for the U.S. since 1947. (The Gini Index is a widely-used measure of income inequality. A higher Gini number means higher inequality.) Note that the Gini reading started climbing in the late ‘70s – the same time when per capita car ownership in the U.S. began to fall.
This chart tells us, not for the first time, that the U.S. has experienced more income inequality since the 1970s. Combined with the per capita auto sales data above, it suggests that as the rich have gotten richer and everyone else has struggled to keep up, car ownership has suffered. Although this is by no means proof of the relationship between income inequality and per capita car ownership over the last 40 years, it hints at an interesting theory – and suggests that the auto industry has good reason to be concerned about growing inequality in the U.S.

Top Reads From The Fiscal Times:
- 6 Reasons Gas Prices Could Fall Below $2 a Gallon
- Hoping for a Raise? Here’s How Much Most People Are Getting
- What the U.S. Must Do to Avoid Another Financial Crisis
Craigslist Car Scams Are on the Rise, Especially in Midwest
An insurance group is warning consumers of a widespread scam in which fraudsters are buying cars on Craigslist with bogus checks.
The National Insurance Crime Bureau has identified nearly 100 instances throughout the Midwest of Craigslist car sales in which the buyers used fake bank checks.
“These scams are well organized and have all the appearances of being legitimate,” NCIB President and CEO Joe Wehrle said in a statement. “But in the end, the criminal gets the car and the sellers or their financial institutions are left on the hook for thousands of dollars still owed on the car.”
Related: A New Vicious Scam Targets Desperate Homeowners
The scam appears to be especially prevalent in states where vehicle owners retain the title despite an outstanding lien. NCIB, a nonprofit supported by the insurance industry, advises car sellers never to sign over the title until they have the money for the sale in hand, even if that means waiting a week or more for a check to clear.
Craigslist offers its own list of tips to avoid scams. Remember, the online marketplace offers no guarantees regarding items bought or sold via its site and little recourse if you are the victim of a scam.
The site’s No. 1 tip is to do all transactions in person. A growing number of police stations now offer dedicated space for people meeting in person for transactions they’ve agreed to online.
Those with information about insurance fraud or vehicle theft can anonymously report it by calling 800-835-6422 or texting keyword “fraud” to TIP411.
15 Restaurants Offering Free Food for Moms on Mother’s Day

Your Mom was the one who taught you to head straight for the clearance racks. Show her how much you've learned by taking her out for some deliciously cheap eats before taking a free garden tour.
Related: 10 Worst States for Working Mothers
Mother's Day Freebies 2015
- Beef O'Brady's: Free Meal with purchase of equal or greater value up to $10
- Billy Sims BBQ: Free Single Meat Sandwich, Side and Drink
- Brick House Tavern & Tap: Free Brunch Entree with Entree Purchase (reservations required)
- Chuck E. Cheese's: Free Individual Thin & Crispy Pizza with $29.99 purchase of Large 1 Topping Pizza, 4 Drinks & 30 Tokens (requires printable coupon, exp. 6/1)
- Corner Bakery: Free 6 Pack Bottoms Up Bundts with Entree Purchase (printable coupon, exp 5/11)
- Fogo de Chao: Free Lunch or Dinner on Next Visit for Moms who dine on Mother's Day
- Hooters: Free Meal with Drink Purchase (up to $10.99)
- Hurricane Grill & Wings: Free Dessert with Entree Purchase
- McCormick & Schmick's: Free Chocolate-Covered Strawberry with your order
- National Public Gardens Day: Free admission 5/8, with many activities continued through Mother's Day
- Orange Leaf: Free 8-oz. Froyo
- PDQ: Free Combo Meal with purchase of a Kids/Combo Meal
- Shoney's: Free Slice of Strawberry Pie with your order
- Spaghetti Warehouse: Free Strawberry Lemonade and Surprise Gift
- Tijuana Flats: Free Entree (must show offer to redeem)
As always, local participation may vary, so call ahead to check - and then make reservations if you can.
This article originally appeared in The Brad's Deals Blog.
Read more from The Brad's Deals Blog:
6 Things You Should Never Waste Your Money
37 Things You Should Always Keep in Your Car
Is Vision Insurance Worth it For You
This Disease Hikes Health Care Costs By More than $10,000 a Year

Medical professionals and economists have been worried about the growing prevalence of diabetes for years. A new report shows their concerns are well placed. In 2013, the per capita health care bills of consumers with diabetes was $15,000, nearly 71 percent ($10,700) higher than those without the disease, according to the Healthcare Cost Institute.
The brunt of those bills are borne by health care providers, but consumers with diabetes have per capita out-of-pocket costs of $1,922, compared to just $738 for those who do not have diabetes.
For those under the age of 65, health care expenses grew an average 4.1 percent from 2012 to 2013, but the increase was even higher among children, who saw expenses rise 7 percent from 2011 to 2012 and then another 9.6 percent from 2012 to 2013.
Related: Diabetes Detection Up in Pro-Obamacare States
“There has been extraordinary growth in health spending for children with diabetes,” HCCI senior research Amanda Frost said in a statement, citing branded insulin as one factor in the increase.
For children, the costs go beyond medication. A 2012 study in Health Affairs found that people who develop diabetes before age 30 make less money than their peers, are more likely to drop out of high school and less likely to attend college.
One of the most widespread chronic diseases in the United States, diabetes care consumes about 10 percent of U.S. health care spending, according to a study by the University of Michigan.
This College Choice Could Make You $3Million Richer

The differences in starting salaries for STEM majors versus those who study the humanities have been widely publicized. Now, a new study looks at how those differences add up over a lifetime of earnings – and the results are staggering.
The lowest paid graduates, early childhood education majors, earn just $39,000 annually mid-career, while the highest paid petroleum engineering majors, make an average of $136,000 per year. Over a career, that difference amounts to more than $3 million, according to the report The Economic Value of College Majors by economists at Georgetown University.
Among the major fields of study, architecture and engineering students earn highest average salary--$83,000 per year, and education majors earn the lowest--$45,000 per year.
Related: 10 Public Universities with the Worst Graduation Rates
The study finds that generally it’s still worth it to go to college. The average bachelor’s degree holder makes $1 million more over a lifetime than a person with just a high school diploma.
A separate report released last fall by the Federal Reserve Bank of New York found that the value of a bachelor’s degree has reached an all-time high of around $300,000. Researchers found that it takes about 10 years to recoup the cost of a degree, a historically low level, down from close to 25 years in the late 1970s and 1980s.
So those education majors should still go to college, but they might be smart to look for more moderately priced options and to be more wary about taking on debt than their engineering peers.
Putin’s Shiny New Tank Breaks Down

According to news reports, including the Associated Press, the pride of the Russian military – Vladimir Putin’s T-14 Armata tank – broke down in the middle of Red Square on Thursday during a practice run of the Victory Day parade scheduled for Saturday. The state-of-the-art tank was one of eight rolling through Moscow Thursday morning when it unexpectedly came to a halt while the others rolled on.
According to the AP, the soldiers on hand first tried to tow the tank away, but were unsuccessful. After about 15 minutes, the problem was apparently solved, and the tank rolled off under its own power.
Related: 7 New Weapons in Vladimir Putin's Arsenal
An executive of the company that produced the tank told the AP that, despite the apparent attempts to tow it away, the tank had not broken down and was functioning properly.
The T-14 is meant to be the main battle tank that will carry the Russian Army into the rest of the 21st century. Its unmanned turret is controlled remotely by crew members safely inside an armored compartment in the body of the tank. It has advanced weapons system and armor, and is believed to be a match for any tank currently in service with North Atlantic Treaty Organization forces.
The T-14 has been written about extensively in the government-controlled Russian press, and its public unveiling is being treated as a major event. In addition, the parade Saturday will be watched not only by millions of Russians, but also by dozens of foreign dignitaries on hand to hel celebrate the 70th anniversary of the end of World War II. That means any malfunction of the tank during the actual parade on Saturday would be terribly embarrassing to the Kremlin.