Automakers Are Having a Record Year, but Here’s a Trend that Should Worry Them

U.S. auto sales closed out the summer on a positive note, topping estimates and casting some rosy light on the health of the American consumer. Recording its best August since 2003, the auto industry is on pace to sell 17.8 vehicles in 2015, well ahead of expectations of 17.3 million. If the numbers hold up, 2015 will be the best year ever for U.S. auto sales, beating the 17.4 million mark set in 2000.
The general consensus is that auto industry is in pretty good shape these days. Gas prices and interest rates are low, boosting the market for cars and light trucks. More than 2 million jobs were added to the U.S. economy in the past year, and more jobs is usually good news for auto sales. The unemployment rate has been trending lower for five years, sitting at a relatively healthy 5.3 percent in July.
Related: What's Next for Oil Prices? Look Out Below!
As with any statistic, though, there’s more than one way to look at the situation. Sure, auto sales are climbing as the economy gets stronger and more Americans hit their local car dealers’ lots. At least to some degree, though, higher auto sales should be expected just as a result of U.S. population growth. And those rising monthly sales figures are masking a continuing trend that is more worrisome for the auto industry: per capita auto sales are still in a long-term decline, even including the solid growth the industry has seen since the end of the recession. Doug Short at Advisor Perspectives did the math and made a graph:

According to Short’s analysis, the peak year for per capita auto sales in the U.S. was 1978. As the red line in the graph shows, the trend is negative since then.
In the graph, per capita auto sales in January, 1976, were defined as 100; the readings in the index since then are relative to that 1976 sales level. As you can see, the index moves higher until August of 1978, when per capita auto sales were up nearly 20 percent over 1976. Since then, per capita auto sales have fallen, reaching a low in 2009 that was nearly 50 percent lower than 1976. Since 2009, per capita auto sales have risen nicely, but are still more than 15 percent below peak.
What could explain the negative trend? Two factors come to mind. First, demographics. It has been widely reported that the millennial generation is less interested in owning cars for a variety of reasons, ranging from a weak economy to a cultural shift away from suburban life. However, the data on millennial car purchases is ambiguous; recently, millennials have started buying cars in volumes that look a lot like their elders. And even if millennials are less interested in buying cars, their preferences can’t explain a shift that began in the 1970s, before they were born.
Related: U.S. Companies Are Dying Faster Than Ever
The other factor that may explain the trend is income inequality. A study of car ownership by the Carnegie Foundation found that countries with higher income inequality have fewer cars per capita. The logic is simple: As more income is claimed by the wealthy, there’s less to go around for everyone else. And that means there’s less money for middle and lower income groups to buy and maintain automobiles, among other things.
Here’s a chart of the Gini index for the U.S. since 1947. (The Gini Index is a widely-used measure of income inequality. A higher Gini number means higher inequality.) Note that the Gini reading started climbing in the late ‘70s – the same time when per capita car ownership in the U.S. began to fall.
This chart tells us, not for the first time, that the U.S. has experienced more income inequality since the 1970s. Combined with the per capita auto sales data above, it suggests that as the rich have gotten richer and everyone else has struggled to keep up, car ownership has suffered. Although this is by no means proof of the relationship between income inequality and per capita car ownership over the last 40 years, it hints at an interesting theory – and suggests that the auto industry has good reason to be concerned about growing inequality in the U.S.

Top Reads From The Fiscal Times:
- 6 Reasons Gas Prices Could Fall Below $2 a Gallon
- Hoping for a Raise? Here’s How Much Most People Are Getting
- What the U.S. Must Do to Avoid Another Financial Crisis
Behind the Housing Market’s Spring Surge

The housing market is emerging from its winter doldrums: Several different measures released this morning all point to a recent pickup in the real estate market.
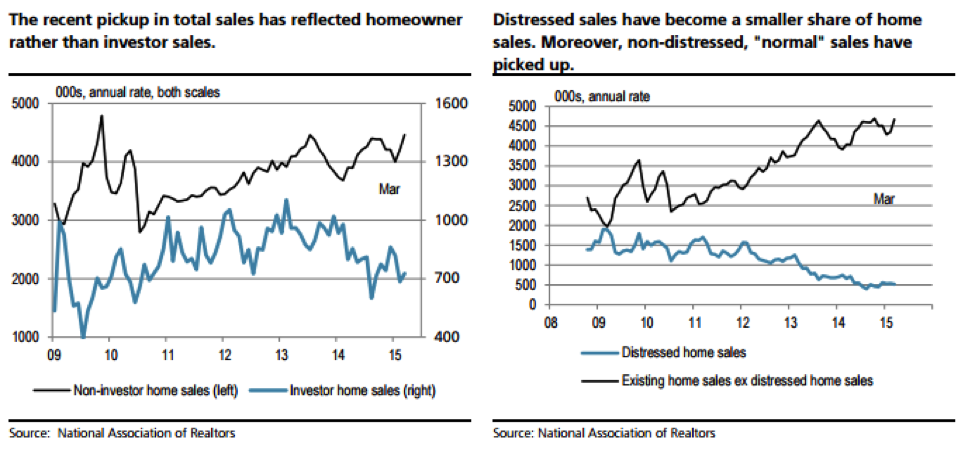
Sales of existing homes jumped 6.1 percent in March to a seasonally adjusted annual rate of 5.19 million — well above expectations and the best month since September 2013. “The pickup in sales is echoed in stronger mortgage applications, new home sales, and faster rising prices—all suggesting a rebound in demand as the spring selling season approaches,” UBS economists wrote Wednesday.
Related: Why the Housing Market Is About to Perk Up
The median sale price last month was $212,100, up 7.8 percent from a year earlier (compared with a 7.2 percent annual gain as of February). “It looks like the combination of limited available inventory and a decline in the share of distressed sales in the market continue to put upward pressure on prices,” J.P. Morgan economist Daniel Silver wrote.

US Existing Home Sales data by YCharts
Mortgage purchase applications, meanwhile, rose 5 percent on a seasonally adjusted basis in the week ending April 17, suggesting that the increased activity from March has also continued into April.
Related: Americans Spend More on Taxes Than on Food, Clothing and Shelter
That trend may also reflect a policy change by the Federal Housing Administration in January. “Almost immediately after the mortgage insurance premium was cut by 50 basis points, purchase applications started to climb to highs not seen since the summer of 2013,” the IHS Global Insight economists Patrick Newport and Stephanie Karol wrote Wednesday. “We expect that the rule change will support market entry among younger buyers.” First-time homebuyers played an important part in the March increase, they suggest, as they increased their purchases by 10 percent year-over-year. Investors, meanwhile, bought 9 percent fewer properties than they had in March 2014, as the charts below from UBS detail.
The housing recovery had softened in recent months, even beyond the winter’s weather-related issues, so the new data — while not yet signaling a stronger trend — is an encouraging sign for increased activity in the spring and potentially beyond. “Home sales should pick up through the rest of 2015,” Gus Faucher, senior economist at PNC Financial Services Group, wrote Wednesday. “The fundamentals for housing are solid, with average job growth (200,000+ per month), good affordability, very low mortgage rates, increasing consumer confidence, expanding access to credit, and significant pent-up demand after years of depressed sales.”
Top Reads from The Fiscal Times:
- America’s Highest Paid CEO: It’s Not Who You Think
- Car Sales Are on Pace to Do Something They Haven’t in 50 Years
- The Companies Americans Hate Dealing With the Most
Christie for President? New Jersey Says ‘Fuhgetaboutit!’
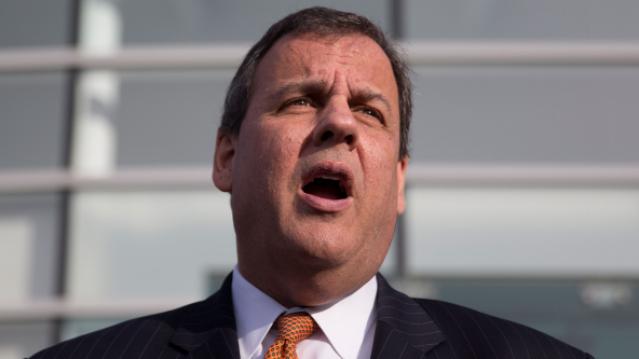
If Governor Chris Christie is looking for a boost to his flagging presidential ambitions, he’s probably not going to get it from the folks back home.
A Quinnipiac University Poll released Monday shows that many New Jersey voters are turned off by Christie and his presidential ambitions, with 56 percent saying they disapprove of his job performance. More than half of those interviewed say that their shoot-from-the-hip Republican governor isn’t trustworthy and that he doesn’t care about their needs. Christie’s 38 percent approval rating is the lowest he has registered since becoming governor in January 2010.
Related: Christie’s Presidential Prospects on a Steady Slide
But it gets worse: 65 percent of Garden State voters say Christie would not make a good president (vs. 29 percent who think he would do a good job), and by similar margins voters say he shouldn’t run.
Meanwhile, more than a third of those interviewed said Christie should be removed from office if it is ultimately determined that he ordered or knew about the infamous closing of traffic lanes in Fort Lee, N.J., that led to massive traffic jams on the George Washington Bridge in early September 2013.
Recently, two reports, commissioned by the state legislature and Christie’s office, failed to turn up any evidence that Christie participated in the scheme – said to be political retaliation against the Democratic mayor of Fort Lee – or knew about it as it happened. However, the U.S. attorney’s office is conducting a criminal investigation of the bridge scheme; there is no indication of when that will be concluded.
Related: Rubio Lashes Out at Clinton on Foreign Policy
The new telephone survey was conducted April 9 to 14 and involved 1,428 New Jersey voters. The findings have a margin of error of +/- 2.6 percentage points.
More Quick Hits from The Fiscal Times:
- 100-Year-Old Coke Bottle Is About to Become a Movie Star
- More Americans Have Health Insurance (Whether They Want it or Not)
The FBI’s Lies, Damned Lies
How many more government agencies will be branded as devious, unreliable or outright fraudulent before the penalties the Justice Department imposes has teeth? Oh, wait, the Justice Department is on the hook for targeting private phone records from Fox News and the Associated Press because of so-called “leaks.”
Then, there are the scandals at the IRS, the Department of Homeland Security, HUD, the Secret Service, Veterans Affairs, the Patent and Trademark Office, the Drug Enforcement Agency, the Labor Department and FEMA — to name just a few.
The FBI case tops all, however, because what they did actually killed people. The Washington Post broke the story on Saturday:
The Justice Department and FBI have formally acknowledged that nearly every examiner in an elite FBI forensic unit gave flawed testimony in almost all trials in which they offered evidence against criminal defendants over more than a two-decade period before 2000.
Of 28 examiners with the FBI Laboratory’s microscopic hair comparison unit, 26 overstated forensic matches in ways that favored prosecutors in more than 95 percent of the 268 trials reviewed so far, according to the National Association of Criminal Defense Lawyers (NACDL) and the Innocence Project, which are assisting the government with the country’s largest post-conviction review of questioned forensic evidence.
The cases include those of 32 defendants sentenced to death. Of those, 14 have been executed or died in prison, the groups said under an agreement with the government to release results after the review of the first 200 convictions.
What’s interesting about all these violations of the public trust is that no one ever seems to go to jail for their crimes. Is the government too big to succeed? We complain about Wall Street execs getting off scott free for their roles in the Great Recession. Why is this different?
More Quick Hits from The Fiscal Times:
Cuomo to Cuba: What's the Payoff?
Maybe a bigger trade in apples from Upstate New York

Andrew Cuomo's trip to Cuba may not actually come home with much, but
100-Year-Old Coke Bottle Is About to Become a Movie Star

The Coca-Cola bottle, with its distinctive contoured glass, was created a century ago as a way for the soft drink company to give its product a competitive edge. As the company website explains, “In 1915, Coca-Cola attempted to fend off a host of copycat brands by strengthening its trademark. The company and its bottling partners issued a creative challenge to a handful of U.S. glass companies: To develop a “bottle so distinct that you would recognize if by feel in the dark or lying broken on the ground.”
The winning design, created by the Root Glass Company of Terre Haute, Ind., worked — so well, in fact, that a century later the company is still using that basic concept to market its signature brand. Coca-Cola this year is celebrating the 100th anniversary of the bottle — and its influence in pop art and other realms — through a global advertising campaign, art exhibitions and a photo book, among other avenues.
Now the bottle and its history will also be the subject of a new “authorized” documentary, according to The Hollywood Reporter. (Coke will help pay for the movie’s marketing.)
Related: Why the Soda Industry Is Still Full of Hot Air
“When I can hold up a Coca-Cola bottle and ask, ‘is this art or is this commerce?’ and most commonly hear ‘it’s both,’ that sets the stage for an intriguing narrative,” the movie’s producer and co-director, Matthew Miele, told THR.
That narrative could include how the Coke bottle became the first commercial product to make it to the cover of Time magazine in 1950, or how it provided fodder for artists like Andy Warhol — and, especially if the film touches on today’s backlash against soda, it might even mention that the 10- and 12-ounce bottles that made their debut in 1955 were called “King Size” and a 26-ounce bottle was marketed as “Family Size.”
Miele and his team reportedly hope their documentary will premiere in November to coincide with the Nov. 16, 1915 date that the bottle design first won a patent.
Top Reads from The Fiscal Times:
- The Harsh Truth About Fast Food for Kids
- The Companies Americans Hate Dealing With the Most
- The 15 Worst Supermarkets in America in 2015