|
A few things are actually going right again in the housing market, although there’s no denying the path to recovery will be a long, slow slog. Sales, new construction, and prices continue to bump along the bottom, as the market digests a mountain of foreclosures. Still, the future is not as bleak as some of the data over the past several months have suggested, especially regarding home prices. Recent trends show the weakness in prices is moderating, inventories are coming down, and foreclosures and short sales are masking an upturn in prices for more traditional transactions.
The various home-price indexes differ in measurements, methodology and readings. The widely-followed Standard & Poor’s/Case Shiller (SPCS) index, like most other April indexes, showed seasonal strength, although prices were still down 4 percent from April 2010. But even after adjusting for seasonal trends, month-to-month declines have been getting progressively smaller since late last year, and April prices were essentially unchanged—down less than 0.1 percent—from March. Moreover, the SPCS index, calculated as a three-month moving average, means the April index contains data from February and March. Stabilization in April will be a plus for price readings in May and June.
May prices continued the pattern of seasonal increases, according to the latest report from CoreLogic. This index posted a second consecutive month-to-month increase. What’s more, the firm separates prices into distressed and non-distressed properties. Distressed sales are either foreclosed properties or short sales -- when the lender accepts a price less than the mortgage balance in order to the avoid the foreclosure process. Overall, CoreLogic says prices in May were down 7.4 percent from a year ago, but excluding distressed properties, prices were about stable from last year—down only 0.4 percent. In recent months, the divergence in the two price trends has widened, with prices excluding distressed sales picking up.

Although some reports on prices and sales have stirred fears of a double-dip housing recession, much of the recent weakness has been fueled by one-off factors. Last year’s homebuyer tax credit allowed buyers to effectively pay more for a house. Economists at UBS estimate that the $8,000 credit for first-time buyers was equivalent to 5.6 percent of the median sales price paid by first-timers, and the maximum $6,500 credit for everyone else was equal to 3.9 percent of the price for existing homes.
By the middle of 2010, the SPCS index was up more than 4 percent from a year earlier. When the tax credit expired in June of last year, sales crashed and prices retreated. As a result, year-over-year price changes so far this year are depressed relative to last year’s inflated levels, but in coming months year-over-year comparisons will favor stronger price growth.
Unusually severe weather in both winter and spring also played a role. Sales of existing homes, which are based on contract closings and thus reflect commitments made in earlier months, fell in both April and May, according to the National Association of Realtors (NAR). Sales in the Midwest and South, which suffered flooding and a record number of tornados, were particularly weak. Pending home sales, which are based on contract signings and foreshadow actual sales one or two months ahead, rebounded 8.2 percent in May.
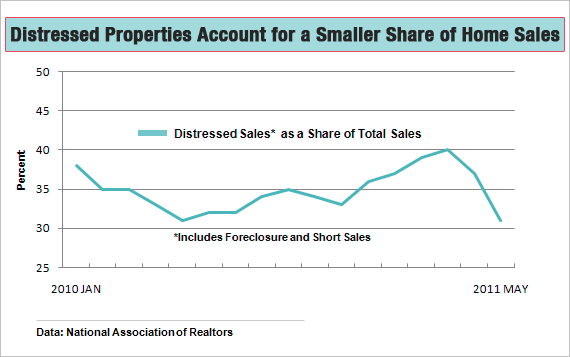
The NAR noted one other potential plus, which dovetails with CoreLogic’s price trends. The share of total sales that were distressed sales, which had been rising, fell sharply to 31 percent in May, the smallest in more than a year and down from 37 percent in April and 40 percent in March. This lessens the downward pressure on overall average of prices. Plus, the NAR says that as of last summer nearly 40 percent of vacant distressed properties were in below average condition, which most likely limits the spread of price weakness to non-distressed properties.

Fewer distressed sales partly reflects inroads made in reducing the so-called shadow inventory of unsold homes, or unlisted homes that are either in foreclosure or more than 90 days delinquent. CoreLogic says the shadow inventory declined by 18 percent, to 1.7 million in April, since its peak in early 2010, partly reflecting a reduced flow of delinquent properties in recent months. The mortgage delinquency rate had fallen to 7.8 percent in the first quarter, according to the Mortgage Bankers Association, down from a peak of 10.5 percent in late-2009.
However, NAR says there are still nearly four million homes in the inventory of listed properties, which would take 9.3 months to sell at the current sales rate. That, by itself, is about twice the normal supply. Builders’ inventories of new homes are a different story. They fell in May to the lowest level in the nearly 50-year history of the data. Builders are sitting on the sidelines, well-positioned for a pickup in sales, but the main problem remains a lack of demand.
The underlying drag on sales is a combination of high unemployment and tight credit, neither of which is likely to improve rapidly. Since the housing boom peaked six years ago, mortgage underwriting standards have swung from overly lax to unusually stringent. Lenders now require bigger down payments, higher credit scores, and a longer income history. NAR chief economist Lawrence Yun says overly restrictive lending is holding back sales and that simply returning to historically normal underwriting practices would give the housing recovery a big boost.
Once prices stabilize, we should see fewer overly conservative bank appraisals and an easing of lending standards, say analysts at Wells Fargo, especially as job and income growth perk up. For now, and despite some of this year’s reports, the housing outlook is at least headed in the right direction, but it’s going to be a long, slow road.
More on housing and the economy from The Fiscal Times:
Foreigners Cash in on U.S. Housing Market Fire Sale
Recovery in Danger as Consumers Tighten Their Belts


