Automakers Are Having a Record Year, but Here’s a Trend that Should Worry Them

U.S. auto sales closed out the summer on a positive note, topping estimates and casting some rosy light on the health of the American consumer. Recording its best August since 2003, the auto industry is on pace to sell 17.8 vehicles in 2015, well ahead of expectations of 17.3 million. If the numbers hold up, 2015 will be the best year ever for U.S. auto sales, beating the 17.4 million mark set in 2000.
The general consensus is that auto industry is in pretty good shape these days. Gas prices and interest rates are low, boosting the market for cars and light trucks. More than 2 million jobs were added to the U.S. economy in the past year, and more jobs is usually good news for auto sales. The unemployment rate has been trending lower for five years, sitting at a relatively healthy 5.3 percent in July.
Related: What's Next for Oil Prices? Look Out Below!
As with any statistic, though, there’s more than one way to look at the situation. Sure, auto sales are climbing as the economy gets stronger and more Americans hit their local car dealers’ lots. At least to some degree, though, higher auto sales should be expected just as a result of U.S. population growth. And those rising monthly sales figures are masking a continuing trend that is more worrisome for the auto industry: per capita auto sales are still in a long-term decline, even including the solid growth the industry has seen since the end of the recession. Doug Short at Advisor Perspectives did the math and made a graph:

According to Short’s analysis, the peak year for per capita auto sales in the U.S. was 1978. As the red line in the graph shows, the trend is negative since then.
In the graph, per capita auto sales in January, 1976, were defined as 100; the readings in the index since then are relative to that 1976 sales level. As you can see, the index moves higher until August of 1978, when per capita auto sales were up nearly 20 percent over 1976. Since then, per capita auto sales have fallen, reaching a low in 2009 that was nearly 50 percent lower than 1976. Since 2009, per capita auto sales have risen nicely, but are still more than 15 percent below peak.
What could explain the negative trend? Two factors come to mind. First, demographics. It has been widely reported that the millennial generation is less interested in owning cars for a variety of reasons, ranging from a weak economy to a cultural shift away from suburban life. However, the data on millennial car purchases is ambiguous; recently, millennials have started buying cars in volumes that look a lot like their elders. And even if millennials are less interested in buying cars, their preferences can’t explain a shift that began in the 1970s, before they were born.
Related: U.S. Companies Are Dying Faster Than Ever
The other factor that may explain the trend is income inequality. A study of car ownership by the Carnegie Foundation found that countries with higher income inequality have fewer cars per capita. The logic is simple: As more income is claimed by the wealthy, there’s less to go around for everyone else. And that means there’s less money for middle and lower income groups to buy and maintain automobiles, among other things.
Here’s a chart of the Gini index for the U.S. since 1947. (The Gini Index is a widely-used measure of income inequality. A higher Gini number means higher inequality.) Note that the Gini reading started climbing in the late ‘70s – the same time when per capita car ownership in the U.S. began to fall.
This chart tells us, not for the first time, that the U.S. has experienced more income inequality since the 1970s. Combined with the per capita auto sales data above, it suggests that as the rich have gotten richer and everyone else has struggled to keep up, car ownership has suffered. Although this is by no means proof of the relationship between income inequality and per capita car ownership over the last 40 years, it hints at an interesting theory – and suggests that the auto industry has good reason to be concerned about growing inequality in the U.S.

Top Reads From The Fiscal Times:
- 6 Reasons Gas Prices Could Fall Below $2 a Gallon
- Hoping for a Raise? Here’s How Much Most People Are Getting
- What the U.S. Must Do to Avoid Another Financial Crisis
The Class of 2015 Isn’t Ready to Join the Workforce

The improving economy means that more employers are offering decent jobs to the Class of 2015, but many of those new graduates don’t feel ready to join the working world.
Only 35 percent of students believe that college was effective in preparing them for a job, and even fewer — 20 percent — feel very prepared to enter the workforce, according to the 2015 Workforce Readiness Survey by McGraw Hill Education.
More than half of students surveyed said they never learned to write a resume in college or how to conduct themselves in a job interview. Nearly 60 percent said they didn’t know how to network or search for a job.
Related: Why the Class of 2015 May Actually Get Good Jobs
The job market has loosened up this year — employers expect to hire nearly 10 percent more new college graduates this year than last year, according ot a study released last month by the National Association of Colleges and Employers. Still, the best gigs remain very competitive, and students who don’t know how to navigate the job search process may find themselves at a disadvantage.
Two-thirds of those surveyed said that they wanted to get more internships or professional experience while in school, and about 60 percent wanted more time to focus on career prep.
Colleges regularly tout their career services departments, but the students surveyed for this report gave those offices poor marks. Only a third thought that their school’s career services department was effective, and a quarter had never used career services.
Cyber Thieves Hit the IRS—and 100,000 Taxpayers

Identity thieves hacked into an Internal Revenue Service data system earlier this year, potentially gaining access to personal financial information for at least 100,000 taxpayers.
The IRS issued a statement today saying that its online system, “Get Transcript,” was breached between February and May, the Associated Press first reported. The portal possesses information including tax returns and other taxpayer data stored by the IRS.
Related: Tax Thieves Could Boost Their Income by 262 Percent
The IRS’s statement said the tax thieves were able to penetrate the system because they had knowledge of 100,000 taxpayers, including dates of birth, Social Security numbers and tax filing details.
The massive hack comes as identity theft is at a record high. Earlier this year, the Treasury Inspector General for Tax Administration (TIGTA) reported that 1.6 million taxpayers were affected by identity theft in 2014 – compared to just 271,000 in 2010.
The IRS’s ability to catch fraudsters was even added to the GAO’s “High Risk List” or the list of federal programs that are most-vulnerable to waste, fraud and abuse.
Auditors attribute the increase to the uptick in electronic filing, which is more convenient for tax filers, but also easier for fraudsters to file fake returns.
TIGTA says the IRS doled out more than $5.8 billion in fraudulent refunds related to identity theft during the 2013 filing season.
The shift to electronic filing is also apparently making taxpayer information even more vulnerable according to the latest breach.
Related: IRS Struggles to Help Victims of Identity Fraud
The hack is obviously bad news for the agency, which is already struggling to address cases of identity theft as they stack up. TIGTA reported the IRS took about 278 days on average to resolve identity theft cases in 2013, despite the agency claiming that it takes about 180 days or six months to resolve issues of identity theft.
When it does complete cases, the IG found that about 10 percent of the “resolved” were riddled with errors.
The latest report comes at a tough time for the IRS, which is struggling with a recent round of budget cuts and is operating with an even greater workload while enforcing at least 40 new tax provisions under the president’s health care law.
The agency said it has temporarily suspended the online service that was the subject of the breach until the vulnerabilities are resolved.
Top Reads from The Fiscal Times:
- Mike Huckabee and His Tax Plan Get Slammed on Fox
- Putin Isn’t Reviving the USSR, He’s Creating a Fascist State
- States Band Together To Keep Obamacare Afloat
Charter to Buy Time Warner Cable: Winners and Losers
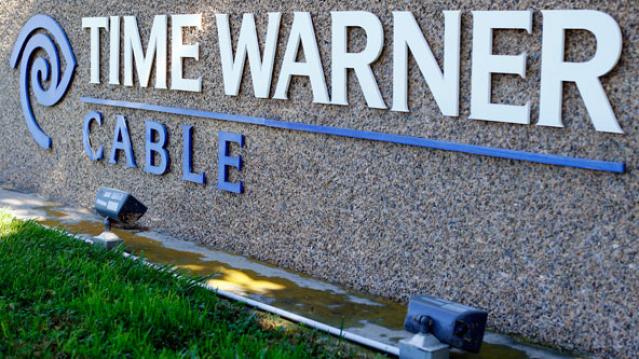
Charter Communications on Tuesday said it will acquire Time Warner Cable in a deal valued at more than $55 billion. Charter will also buy Bright House Networks, a smaller cable company, for $10.4 billion. The two deals combined will make Charter into the second-largest cable and broadband provider in the U.S., with about 24 million subscribers, behind only Comcast, which has about 27 million subscribers.
WINNERS
Time Warner shareholders: An extra $10 billion over the $45.2 billion Comcast had offered sure makes for a nice payday after the earlier deal got scrapped. “Time Warner Cable has succeeded in extracting a fantastic price for its shareholders, far exceeding our expectations,” Morningstar strategist Michael Hodel wrote Tuesday. Hedge fund managers John Paulson of Paulson & Co. and Chris Hohn of Children’s Investment Fund Management reportedly both had sizable holdings in Time Warner Cable.
Time Warner Cable subscribers: The company’s service is reviled by customers. Charter’s isn’t exactly beloved, either, and subscribers may not see any immediate changes, but Charter promises that the deal will translate into faster broadband for subscribers and more free public Wi-Fi. Whether it actually does or not, the deal seems to spell the end of the Time Warner Cable name. Subscribers won’t miss it.
John Malone: The Liberty Media billionaire finally gets the megadeal he’s been looking for to make Charter Communications into a major industry power. If the deals goes through, the company would become the second-largest cable and broadband provider in the country, with some 24 million total subscribers.
Related: Charter and Time Warner Cable Merger: It’s All About Broadband
LOSERS
Comcast: At least CEO Brian Rogers was graceful about the prospect of a larger competitor. "This deal makes all the sense in the world,” he said in a statement. “I would like to congratulate all the parties."
Television content providers: One rationale for the deal is that the scale of the combined company will afford it more leverage in its negotiations with programmers.
Cable customers and online video watchers? The proposed deal still concerns consumer advocates like those at public interest group Free Press. “The issue of the cable industry's power to harm online video competition, which is what ultimately sank Comcast’s consolidation plans, are very much at play in this deal,” said Derek Turner, research director for Free Press. “Ultimately, this merger is yet another example of the poor incentives Wall Street’s quarterly-result mentality creates. Charter would rather take on an enormous amount of debt to pay a premium for Time Warner Cable than build fiber infrastructure, improve service for its existing customers or bring competition into new communities.”
Bloomberg for President? Today There Was a Telling Tweet

Who is the only person who could nail the Democratic nomination for president if Hillary Rodham Clinton falters? According to USA Today columnist Michael Wolff, it’s not declared candidate Sen. Bernie Sanders of Vermont or about-to-declare former Maryland Gov. Martin O’Malley or progressive champion Sen. Elizabeth Warren of Massachusetts.
Nobody has the cash — which Wolff pegs at close to $2 billion — that would be required to mount a competitive race except for one potential candidate who been down the “will he or won’t he?” road before: former New York Mayor Michael Bloomberg. Wolff calls the self-made billionaire the obvious and only alternative because of his money, first and foremost, but also because of his “progressive social conscience with pro-growth-economic views.”
Related: Is America Ready for a Liberal Rock ‘n Roll President?
Of course, there is no reason to take Wolff seriously. Since leaving City Hall, Bloomberg has been busy reestablishing his direct control over Bloomberg L.P., the financial data and media behemoth he founded, and he hasn’t even offered a tease about possibly running.
But this morning, the Wolff column was tweeted out by Kevin Sheekey, who managed Bloomberg’s three winning campaigns for mayor. Sheekey, a former deputy mayor, is currently head of government relations and communications at Bloomberg.
“Next February say, if the sky falls in on Hillary — one or more of the storm-cloud scenarios breaking over her head — would Michael Bloomberg step up?” Wolff asks.
Kevin Sheekey probably knows the answer.
Billionaires: 10 Intriguing New Facts About Who’s Getting Rich Now
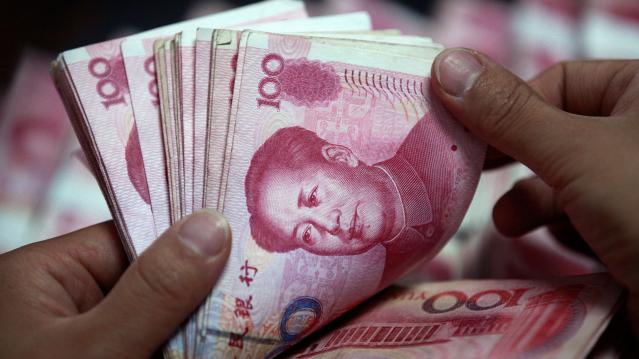
A new Chinese billionaire was created almost every week in the first quarter of 2015, according to a just-released report by UBS and PwC.
"Asia's billionaires make up 36 percent of self-made billionaire wealth, overtaking Europe for the first time and second only to the U.S.," said Antoinette Hoon, private banking advisory services partner for PwC in Hong Kong. “Looking forward, we expect the region to be the center of new billionaire wealth creation.”
Related: 6 Traits of an Emerging Millionaire: Are You One?
The report, which looked at data for 1,300 billionaires over 19 years, found – unsurprisingly -- that entrepreneurship is a powerful force for wealth creation. “Billionaires: Master architects of great wealth and lasting legacies" also noted that many billionaires are embracing philanthropy to build a legacy.
Here are 10 other findings of the report:
- 917 self-made billionaires generated more than $3.6 trillion of global wealth between 1995 and 2014.
- Of them, 23 percent launched their first business before age 30; 68 percent before turning 40.
- The second-highest number of self-made American billionaires (27.3 percent) in the last two decades came out of the tech sector.
- Finance produced 30 percent of U.S. billionaires, but they aren’t as rich as their counterparts in tech; their average net worth is $4.5 billion, compared with $7.8 billion for tech moneybags.
- In Europe and Asia, self-made billionaires mostly made their money in the consumer industry. Their wealth averages $5.7 billion. Tech entrepreneurs in Europe and Asia were the second-richest group with an average worth of $3.8 billion.
- More than two-thirds of global billionaires are over 60 years old and have more than one child.
- The average age of Asia billionaires is 57, 10 years younger than in the U.S. and Europe.
- About one fourth of Asian billionaires had impoverished childhoods, compared with 8 percent in the U.S. and 6 percent in Europe.
- 60 percent of self-made billionaires in the U.S. and Europe retain their businesses, 30 percent dispose of part of their business via an IPO or trade sale, with 10 percent selling outright.
- In Europe and Asia, billionaires are most likely to create a business dynasty, with 57 percent of European and 56 percent of Asian billionaire families, respectively, taking over the family business when the founder retires. In the U.S., just 36 percent of businesses remain family-run once the founder retires.